Another move up for goldHi traders,
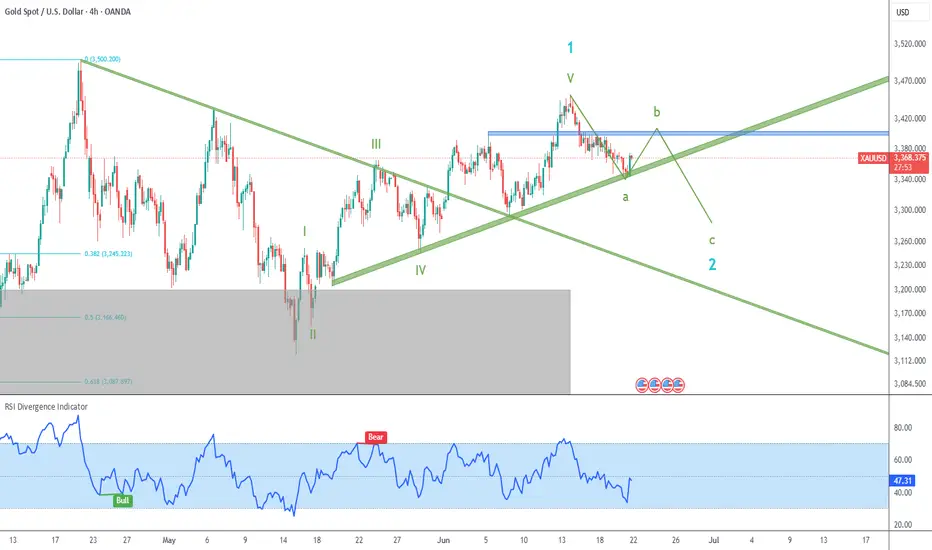
Last week gold made a bigger (overlapping) correction down (wavecount updated). Price could be making an ending diagonal (wave 5)
If this is correct, then next week we could see a small correction down and more upside.
Let's see what price does and react.
Trade idea: Wait for a small correction down on a lower timeframe to finish and trade longs again.
If you want to learn more about trading FVG's & liquidity sweeps with wave analysis, please make sure to follow me.
This shared post is only my point of view on what could be the next move in this pair based on my technical analysis.
Don't be emotional, just trade your plan!
Eduwave
Elliott Wave
fartcoin trade ideathe orange impulsive wave is unfolding however the wave 3 is very weak and it didn't even took the wave 1 high but it is still allowed and can be called weak wave 3 so Wave 4 should unfold the support zones are mentioned with green box as area of opportunity I expect the wave 5 to be the biggest wave compared to 1 and 3 target for wave 5 is also mentioned
Another drop for SPX500USDHi traders,
Last week SPX500USD broke the low of the previous week just as I've said in my outlook. After that it went up again. This pair is still in a bigger correction down.
So next week it could drop again into the direction of the bullish Weekly FVG.
Let's see what the market does and react.
Trade idea: Wait for a small correction up on a lower timeframe to trade short term shorts to the previous Weekly lows.
If you want to learn more about trading FVG's & liquidity sweeps with Wave analysis, then please make sure to follow me.
This shared post is only my point of view on what could be the next move in this pair based on my technical analysis.
Don't be emotional, just trade your plan!
Eduwave
EU could go up againHi traders,
Last week EU made a bigger (overlapping) correction to the downside so now the wave count is invalid. I must admit that I don't see a clear Elliott wave pattern. There are multiple options.
This last pattern could be a corrective pattern and next week we could see a next impulsive wave.
Or it is a bearish leading diagonal and next week we could see this pair drop.
At the moment my main (fundamental) bias is still bullish.
But let's see what the market does and react.
Trade idea: Wait for more development of price action.
If you want to learn more about trading with FVG's, liquidity sweeps and Wave analysis, then make sure to follow me.
This shared post is only my point of view on what could be the next move in this pair based on my technical analysis.
Don't be emotional, just trade your plan!
Eduwave
MicroStrategy another pull back before all time high?NASDAQ:MSTR analysis update..
📉 𝙇𝙤𝙣𝙜 𝙩𝙚𝙧𝙢 The weekly R5 pivot target is bold at $1500 but definitely possible as a max greed scenario when the triple tailwind of Bitcoin, SPY and Bitcoin treasury companies trends return.
📉 𝙎𝙝𝙤𝙧𝙩 𝙩𝙚𝙧𝙢 retracement is expected to end around the S1 pivot at $341 and a secondary target of $321.
Irans conflict has investors shaken and not willing to hold assets over the weekend on the fear of worse. However, if the conflict is resolved soon investors could have a great buying opportunity.
𝙏𝙚𝙘𝙝𝙣𝙞𝙘𝙖𝙡 𝘼𝙣𝙖𝙡𝙮𝙨𝙞𝙨
Price appears to have completed wave (B) of an ABC correction in wave 4. Wave C is underway with an expected thrust down (such is the nature of wave C) towards the daily S1 pivot $341. This is also the 0.382 Fibonacci retracement, a high probability area for wave 4 to end. A deeper correction will bring up a triple shield of the High Volume Node, ascending daily 200EMA and 0.5 fibonacci retracement at £321.
Daily DEMA has death crossed.
Safe trading
AERO: Clears the Runway! Can it gain altitude!?AERO gave a valid long setup
We were eye a possible retrace of an impulsive move and it displayed enough to trigger a rules-based entry.
Technical Breakdown
Key structural elements supported the setup:
Initial leg up showed impulse-like behavior
Pullback found support at a clearly defined AOI
Multiple MLT levels aligned with a common zigzag framework
Swift bounce off the Golden Corner Pocket (GCP)
Break and close above 0.54 completed the impulse structure
Prior resistance flipped into support
Volume confirmed the move, and price reached the first algo target, producing a reactive wick and confirming potential of algo activity.
This created a textbook TDU-style GCP/Algo/C-3 setup with measured entry and exit.
Risk Management
Partial profit was taken at the first MLT zone
Stop loss was moved into profit post-structure break
Scenario planning:
If move continues: positioned
If move stalls as a larger zigzag: no loss
Outlook
Attention now shifts to the next actionable level, possible second entry long
0.62 is the AOI for re-entry atm
Ideal scenario = Continuation in a wave 3, obvi
Alt scenario = Clean corrective to AOI + long
Bear scenario = Zig Zag complete
Conclusion
The trade played by the book!
Confluence across AOI, GCP, MLT, and volume created a qualified entry — not a guess.
This remains a great example of structure over sentiment and waiting for the market to meet criteria before engaging.
Google MUST hold this critical level!NASDAQ:GOOG local analysis update
📈 𝙇𝙤𝙣𝙜 𝙩𝙚𝙧𝙢 Further decline below the daily 200EMA, High Volume Node (HVN) and pivot point which it closed below on Friday could see google price fall back below $140.
📉 𝙎𝙝𝙤𝙧𝙩 𝙩𝙚𝙧𝙢 the bullish run has ended with Fridays bearish engulfing, first support below the support it is currently sat at is $156.
Irans conflict has investors shaken and not willing to hold assets over the weekend on the fear of worse news. However, if the conflict is resolved investors could have a great buying opportunity.
𝙏𝙚𝙘𝙝𝙣𝙞𝙘𝙖𝙡 𝘼𝙣𝙖𝙡𝙮𝙨𝙞𝙨
Price is challenging a triple shield: major support HVN, daily pivot and the daily 200EMA. Holding this level is critical and locks in a corrective Elliot Wave pattern from the $140 level completing between the 0.5-0.618 Fib retracement.
Daily DEMA Is about to produce a death cross while RSI is neutral with plenty of room to fall.
Safe trading
Aptos IdeaThe whole aptos chart is composed of corrective patterns and I do think we are now at the end of wave a and it might be a running flat where wave b is explosive towards upside exceeding start of wave a i have marked the level where we might end the wave b @ 1.618 targeting ATH around 22$ the wave B tends to be very fast so be positioned before
tp ATH Sl can be the 3.89$ very good setup 23RR
EURUSD Gearing Up for Next Leg Up – DXY Weakens After PPI MissToday, key U.S. economic indexes were released, providing fresh insights into inflationary pressures and the state of the labor market:
Core PPI m/m:
Actual: 0.1% | Forecast: 0.3% | Previous: -0.4%
Lower than expected – suggests weaker underlying producer inflation.
PPI m/m:
Actual: 0.1% | Forecast: 0.2% | Previous: -0.5%
Slight miss – overall inflation at the producer level remains soft.
Unemployment Claims:
Actual: 248K | Forecast: 242K | Previous: 247K
Slightly higher than forecast – signaling some cooling in the labor market.
Market Outlook :
These data releases point toward cooling inflation and softness in job growth, which may strengthen the dovish narrative around the Fed’s next move.
DXY Index ( TVC:DXY ) is under pressure, and EURUSD ( FX:EURUSD ) is showing signs of bullish momentum .
-----------------------------------------------------------
Now let's take a look at the EURUSD chart on the 1-hour time frame .
EURUSD is trading near the Heavy Resistance zone($1.182-$1.160) and Monthly Resistance(2) .
In terms of Elliott Wave theory , EURUSD appears to be completing microwave 4 . Microwave 4 could be completed at one of the Fibonacci levels .
I expect EURUSD to attack the Heavy Resistance zone($1.182-$1.160) at least once more after completing microwave 4 and could even rise to the Potential Reversal Zone(PRZ) .
Note: If EURUSD touches $1.1446 , we can expect more dump.
Please respect each other's ideas and express them politely if you agree or disagree.
Euro/U.S. Dollar Analyze (EURUSD), 1-hour time frame.
Be sure to follow the updated ideas.
Do not forget to put a Stop loss for your positions (For every position you want to open).
Please follow your strategy and updates; this is just my Idea, and I will gladly see your ideas in this post.
Please do not forget the ✅' like '✅ button 🙏😊 & Share it with your friends; thanks, and Trade safe.
XAU Updated CountThis is my current trade plan for Gold. I don´t believe the correction is over, and will be watching for potential shorts after some upside movement (green b -> c trade).
But the bigger opportunity will be on the conclusion of green c / blue 2, from where we can really get another strong leg to the upside.
BTC Experiencing Retracement: Bound for Mid to Lower 90k Range?Bitcoin appears to have officially commenced its retracement.
The yellow-box support zone around 96k-92k may serve as a key level to watch, though a dip as low as 90k wouldn’t be out of the question.
As shown by the provisional Elliott Wave count labeled corrective wave ABC, I interpret this as a short- to mid-term correction. While Wave C can take various forms, this scenario anticipates a typical diagonal triangle structure.
GOLD → Consolidation within a falling wedgeFX:XAUUSD is consolidating. A major player is gathering a trading position inside a wedge ahead of distribution. But the main question is: in which direction?
Gold lost ground again on Friday after mixed holiday trading on Thursday. Traders are waiting for new signals from the Fed and monitoring the situation in the Middle East. Interestingly, gold fell as the conflict escalated further (which is not logical overall). The dollar is in a global bearish trend, and traders are waiting for a decision from Powell (who is under pressure from Trump to cut rates).
Technically, if we look at the wedge, we can see how difficult it is for the market to move. The price is stuck inside the consolidation. The intraday movement is very short, with long tails and a very weak reaction to both false breakouts and level break. Large players are building up positions inside the current channel. This may only hint at the possibility of future implementation (distribution).
Resistance levels: 3360, 3396, 3420
Support levels: 3338, 3320, 3302
On D1 - H4, gold is in a countertrend (bullish trend) correction and is testing the trend support + 0.7 Fibo zone. Below, there are fairly strong areas of interest — 3320 and 3302 — which gold may test before rising. However, within the wedge, there is a fairly high probability of a breakout of resistance and the 3360 level, followed by a rally to the liquidity zone at 3396
Best regards, R. Linda!
ETH: Hardly Any Volatility Not much has happened for Ethereum since yesterday. According to our primary scenario, wave B in turquoise should imminently push higher, theoretically up to resistance at $4,107. Once these corrective rises conclude, wave C should take over, driving ETH down to complete the large green wave in the Target Zone below ($935.82 – $494.15). The low of this multi-year correction should lay the foundation for subsequent wave increases, likely causing new record highs above the $10,000 mark, as the weekly chart suggests. In our alternative scenario, ETH would embark on this bullish journey earlier. Currently at 27% probability, this alternative assumes the corrective low was already established at $1,385, which would imply a direct breakout above $4,107.
📈 Over 190 precise analyses, clear entry points, and defined Target Zones - that's what we do.
BTC - Key Battle Between Bulls and Bears – Symmetrical TriangleBitcoin ( BINANCE:BTCUSDT ) is currently consolidating within a Symmetrical Triangle , showing indecision among Bulls and Bears around the Support zone($104,380-$103,060) and just above the 50_SMA (Daily) .
From an Elliott Wave perspective, the current range may represent a WXY corrective structure . The market seems to be waiting for a breakout direction , potentially aiming to complete wave 5 after this correction.
The Monthly Pivot Point($103,300) and the presence of significant Cumulative Liquidation Leverage Zones (both Long and Short ) are key liquidity magnets to watch in the short term .
I expect Bitcoin to re-attack the Support zone($104,380-$103,060) AFTER breaking the lower line of the Symmetrical Triangle Pattern and decline to the targets I have outlined on the chart.
Note: Stop Loss: $106,703 = Worst Stop Loss(SL)
Please respect each other's ideas and express them politely if you agree or disagree.
Bitcoin Analyze (BTCUSDT), 1-hour time frame.
Be sure to follow the updated ideas.
Do not forget to put a Stop loss for your positions (For every position you want to open).
Please follow your strategy and updates; this is just my Idea, and I will gladly see your ideas in this post.
Please do not forget the ✅' like '✅ button 🙏😊 & Share it with your friends; thanks, and Trade safe.
Litecoin Is Forming A Bullish PatternLitecoin with ticker LTCUSD made nice and clean five-wave recovery back to 100 area in the 4-hour chart, which confirms support in place and bullish reversal, so it can be a higher degree wave (1), thus more upside is expected for a higher degree wave (3) after current complex W-X-Y correction in wave (2) that can be in final stages. First support is here around 90-85 area, while second deeper one would be at 80 area.
Sei trade plan SEI/USDT – Bearish Zigzag Correction In Play | Waiting for the Final Leg C
📉 Current Structure:
The chart displays a developing A-B-C zigzag correction.
Wave a is complete, and price is currently unfolding wave b, pushing into a key supply zone between 0.4388 – 0.5112 USDT.
This zone also aligns with major Fibonacci retracements:
🟡 50% at 0.4388 TP1
🟢 61.8% at 0.5112 TP 2
🔵 78.6% at 0.6143 (max deviation before invalidation) TP3 if given
traders can trade the wave b I have marked the entry and Sl it's a 4RR high probability setup
Targets for Wave C:
🎯 Primary Target (1.0 extension): 0.0789 USDT
GateChain Slows Down Within An Impulsive Bullish TrendGateChain with ticker GTUSD came slightly lower, but we still see it trading in a higher degree wave »iv« correction that can resume the bullish trend for wave »v«. It can be actually finishing final subwave (c) of a three-wave (a)(b)(c) corrective decline, so keep an eye on strong support here at the former wave (iv) swing low and 38,2% Fibonacci retracement. If we get sharp rebound and impulsive rise back above channel resistance line near 20 bullish confirmation level, then we can easily expect further rally within final wave »v« of 5 this year, which can push the price even up to 35 – 40 target area.