XAUUSDHello Traders! 👋
What are your thoughts on GOLD?
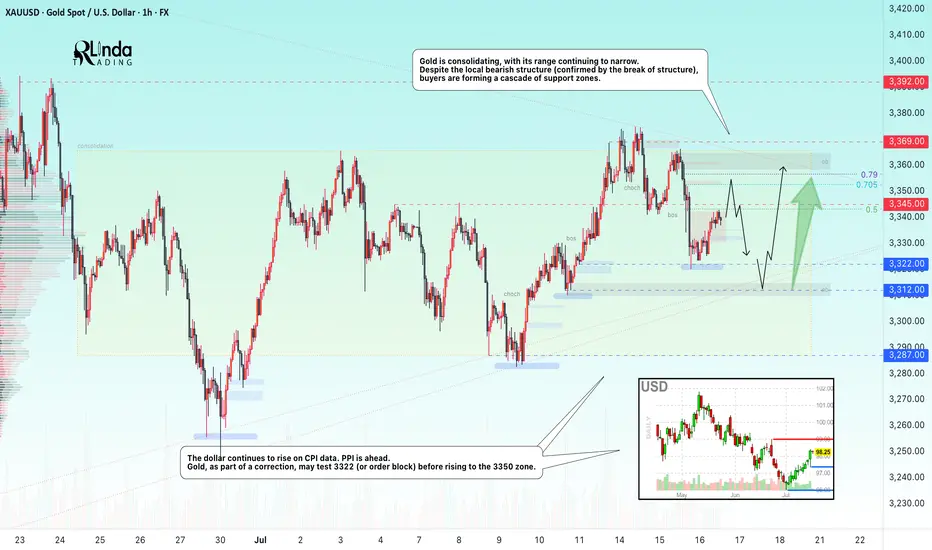
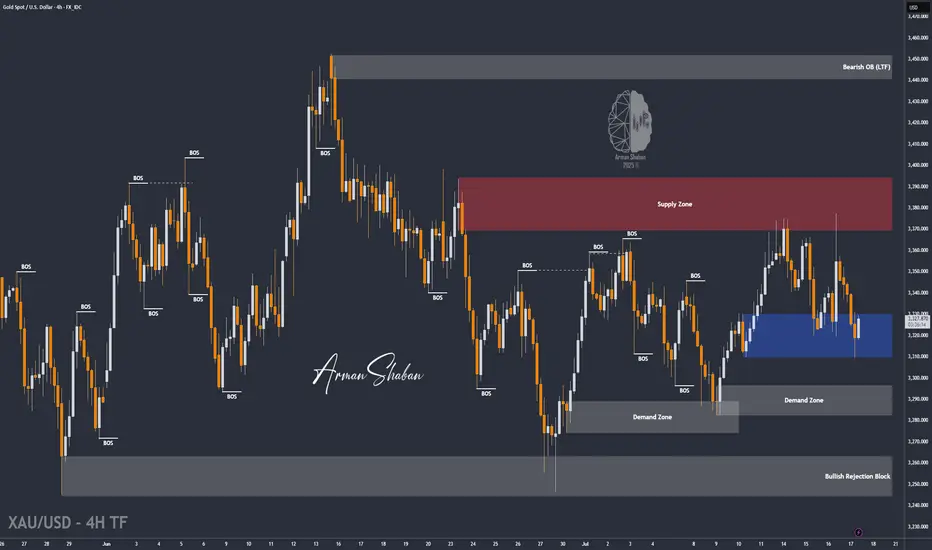
Gold has broken above its descending trendline and completed a successful pullback to the breakout level. Now, the price appears ready to resume its upward move, but it's still facing resistance near the $3375 level.
We expect another attempt to break through the $3375 resistance zone.
A confirmed breakout above this area would open the path toward higher targets and potentially trigger strong bullish momentum.
As long as price holds above the broken trendline and key support zone, the overall bias remains bullish.
Don’t forget to like and share your thoughts in the comments! ❤️
Community ideas
GOLD → Borders are shrinking. Consolidation continues...FX:XAUUSD is adjusting amid controversial CPI data and confirming the local bearish market structure. The PPI is ahead, and gold is consolidating, with its boundaries continuing to narrow...
Gold is recovering slightly but remains under pressure amid rising bond yields and a stronger US dollar. Higher inflation in the US reduces the chances of a quick Fed rate cut. Traders are cautious ahead of the PPI data release. If producer inflation exceeds forecasts, the dollar may rise again, putting further pressure on gold
Technically, we see consolidation in a symmetrical triangle pattern. Trading within the consolidation has a negative side - low volatility and unpredictable movements. The purpose of such movements is accumulation. However, decisions can be made based on relatively strong levels. In the current situation, we are seeing a rebound from 0.5 Fibonacci (I do not rule out a retest of the 0.7 zone before correction). The price may head towards the liquidity zone of 3322 before rising to the upper boundary of the consolidation and the zone of interest of 3350-3360.
Resistance levels: 3345, 3353, 3369
Support levels: 3322, 3312, 3287
The problem is that the price is in a consolidation phase. That is, technically, it is standing still and moving between local levels. You can trade relative to the indicated levels. Focus on PPI data. At the moment, gold is in the middle of a triangle and is likely to continue trading within the boundaries of a narrowing channel due to uncertainty...
Best regards, R. Linda!
EURUSD – Bearish Rhythm ContinuesEURUSD is currently moving within a well-defined descending channel on the 4H timeframe, maintaining a consistent pattern of lower highs and lower lows. This confirms that bearish order flow remains intact, especially after the recent rejection from the upper boundary of the channel. The previous move up was largely a liquidity grab, taking out short-term highs before swiftly reversing, which adds confluence to a continuation lower.
Liquidity and Imbalance Zones
After sweeping some upside liquidity near 1.1670, price left behind a clean set of equal lows and an unmitigated fair value gap (FVG) sitting below, acting as a magnet. The purple zone marks this FVG, which is likely to be the next area of interest for price as it aligns with the midpoint of the channel and previous demand. Below that, there’s also a clear support region with resting liquidity, giving price a solid reason to reach deeper before reversing.
Projected Path and Channel Dynamics
As long as we remain inside the current bearish channel, we should expect price to respect the internal structure and continue pushing lower. The expectation is for price to trickle down through lower highs and lower lows, tapping into the FVG and potentially sweeping the lows beneath it. The projected internal path mimics this staircase-style movement down before any potential reversal can happen.
Reversal Zone and Bullish Scenario
If price does sweep the lows around 1.1450 and fills the imbalance cleanly, this would create ideal conditions for a bullish reversal. A reaction from this zone could lead to a break of the channel structure, initiating a shift in market sentiment. The upside target, in that case, would be the clean area around 1.1700 where previous liquidity was removed but not yet retested.
Short-Term Expectation
In the short term, the path of least resistance remains bearish. The most probable scenario is a continuation down into the FVG and potential liquidity sweep before we see any meaningful upside. Any premature breakout from the channel without first collecting this liquidity would be viewed as a weak move lacking proper fuel.
Conclusion
EURUSD remains technically bearish while inside the descending channel. Liquidity has been taken on the upside, and the path is now open to target unmitigated imbalances and resting lows. A full sweep into the FVG area could provide the setup for a clean reversal, but until then, trend continuation is favored.
Disclosure: I am part of Trade Nation's Influencer program and receive a monthly fee for using their TradingView charts in my analysis.
___________________________________
Thanks for your support!
If you found this idea helpful or learned something new, drop a like 👍 and leave a comment, I’d love to hear your thoughts! 🚀
Lingrid | GOLD Continues to See Range-Bound MovementOANDA:XAUUSD is forming a bullish structure above the confluence of the downward trendline and horizontal support at 3,310. A strong impulse move followed by a triangle consolidation hints at an emerging continuation pattern, with buyers preparing for another leg higher. Price is currently approaching a key decision zone where previous support and diagonal confluence intersect, creating a launchpad scenario. If price confirms support above 3,311, a rebound toward the 3,356–3,382 zone becomes likely.
📉 Key Levels
Buy trigger: Rebound from 3,310–3,320
Buy zone: 3,300–3,315
Target: 3,356 and potentially 3,380
Invalidation: Break and close below 3,250
💡 Risks
Breakdown below the support zone may trigger extended retracement
False breakout through triangle resistance without volume
Sudden volatility from macroeconomic catalysts (e.g., Fed comments or CPI data)
If this idea resonates with you or you have your own opinion, traders, hit the comments. I’m excited to read your thoughts!
EURUSDHello Traders! 👋
What are your thoughts on EURUSD?
EURUSD has broken support level and its ascending trendline, indicating a possible shift in short-term market structure and growing bearish pressure.
In the short term, we expect a pullback toward the broken support/trendline zone.
If price fails to reclaim this level, a continued move lower toward the next identified support zone is likely.
As long as price remains below the broken structure, the short-term outlook stays bearish.
Don’t forget to like and share your thoughts in the comments! ❤️
ETH eyes on $3431.83: Golden Genesis fib may END this SurgeETH finally got a surge after a long consolidation.
But has just hit a Golden Genesis fib at $3431.83
Like hitting a brick wall, it is now staggering back.
It is PROBABLE that we orbit this fib a few times.
It is POSSIBLE that we reject here to end the surge.
It is PLAUSIBLE that we Break-n-Retest to continue.
We were here at this EXACT spot 8 months ago:
=============================================
.
XAU/USD | First LONG to $3345, Then a Potential DROP Below $3300By analyzing the gold chart on the 4-hour timeframe, we can see that last night the price first tapped into the $3340 level, showing an initial push up to $3352. However, the drop intensified soon after, breaking the $3340 resistance and, according to the second scenario, falling to $3310. Upon reaching this key demand level, buying pressure kicked in, pushing the price back up to $3325. Now, the key question is whether gold can hold the $3310 support. If this level holds, we can expect a rise toward $3331 as the first target and $3345 as the second. After this move, a rejection from the $3345 area could trigger another drop, possibly pushing gold below $3300. So, first LONG, then SHORT!
THE LATEST VIDEO ANALYSIS :
Please support me with your likes and comments to motivate me to share more analysis with you and share your opinion about the possible trend of this chart with me !
Best Regards , Arman Shaban
Gold 30Min Engaged ( Bearish Reversal Entry Detected ) what do you think before Price Move , GOLD Bullish or Bearish & why ?
lets spread the Knowledge
➕ Objective: Precision Volume Execution
Time Frame: 30-Minute Warfare
Entry Protocol: Only after volume-verified breakout
🩸 Bearish Reversal : 3339 Zone
🩸 Bullish Reversal : 3311Zone
➗ Hanzo Protocol: Volume-Tiered Entry Authority
➕ Zone Activated: Dynamic market pressure detected.
The level isn’t just price — it’s a memory of where they moved size.
Volume is rising beneath the surface — not noise, but preparation.
🔥 Tactical Note:
We wait for the energy signature — when volume betrays intention.
The trap gets set. The weak follow. We execute.
GOLD ROUTE MAP UPDATEHey Everyone,
Quick follow-up on yesterday’s 1H chart update
After hitting 3353, we did not see an EMA5 cross and lock above this level. That lack of confirmation was key and it validated a rejection right at 3353, leading to another drop into the retracement zone.
As per plan, that retracement provided yet another clean bounce, perfectly in line with our dip buying strategy.
We are once again looking toward 3353, and just like before, we will be closely watching for an EMA5 cross and lock confirmation to validate any continuation.
This kind of movement continues to confirm the power of patience, structure, and disciplined execution. No chasing just clean planned executions with high probability setups based on our EMA5 methodology.
We’re also still watching the 3381 gap a key magnet above, and a level we’ve been tracking since the Monday outlook. The roadmap remains unchanged. We’re trading the structure, managing risk, and letting confirmations guide the execution.
Updated Reminder of Key Levels:
BULLISH TARGET
3381
EMA5 CROSS & LOCK ABOVE 3381 opens
3416
EMA5 CROSS & LOCK ABOVE 3416 opens
3439
BEARISH TARGETS
3353 ✅ HIT
EMA5 CROSS & LOCK BELOW 3353 opens
3328 ✅ HIT
EMA5 CROSS & LOCK BELOW 3328 opens
3305
EMA5 CROSS & LOCK BELOW 3305 opens Swing Range:
3288
3259
As always, we’ll continue monitoring and sharing updates, as price reacts around these zones. Thank you all for the continued support, your likes, comments, and follows are genuinely appreciated!
Mr Gold
GoldViewFX
‘Everything Rally’ in Full Swing. What About Tariffs & Earnings?It’s official: we’re witnessing one of those rare, confounding moments when nearly every big risk-on thing is screaming ATH! (All-Time High, for those who haven’t worn out that abbreviation on X this month).
Bitcoin BITSTAMP:BTCUSD blew past $122,000 on Monday — a turbo rally that made anyone who stepped away to brew coffee rethink their life choices.
Meanwhile, Nvidia NASDAQ:NVDA ? It didn’t just approach the $4 trillion milestone — it showed up, took the crown as the world’s most valuable company , and made the Nasdaq Composite NASDAQ:IXIC pop a fresh record close for dessert.
And the S&P 500 SP:SPX ? The broadest slice of US equities did its part too, hitting a record high last week, despite the world’s loudest tariff chatter from Trump 2.0. So, what gives?
💎 Bitcoin: Too Fast to Chart
Let’s start with the fire-breathing dragon. Bitcoin BITSTAMP:BTCUSD rocketed to $122,500 on Monday morning, bruising all those short sellers and juicing up the memes. The OG coin now has a market cap above $2.3 trillion — bigger than most economies, enough to make gold bugs break into cold sweats. (True, it did pare back some of those gains to float at $119,000 Thursday morning.)
What’s fueling it? Institutional FOMO. Forget diamond hands — big money managers, ETF behemoths , and corporates are scooping up every sat they can find.
When you see that, plus macro tailwinds — a weaker dollar, simmering inflation that nudges the Fed toward cuts — the rocket fuel writes itself. But we all know what traders really want to know: is $125,000 next? Short answer: if momentum holds, you bet. Long answer: mind the next Fed move and the tariff chess match.
🎯 Nvidia: From GPUs to GDPs
If you thought Bitcoin’s wild run was the only headline, look again. The real flex this month came from Jensen Huang’s chip juggernaut. Nvidia NASDAQ:NVDA didn’t just break a record — it basically invented a new category for corporate mega-caps.
The world’s biggest semiconductor firm hit the $4 trillion mark — the first company ever to do so. And this isn’t some overnight fad. Back in 2019, Nvidia crossed $100 billion for the first time on the back of crypto mining booms.
Five years later, it’s stacked on 4,000% gains, riding the AI hype like it’s a permanent bull market. Governments, hyperscalers, cloud titans — they’re all shoving billions at Huang’s AI chips.
💻 Nasdaq: AI, Chips, Crypto — Party On
The Nasdaq Composite NASDAQ:IXIC logged yet another record close , up about 7.5% on the year so far.
Just three months ago, this index looked battered — trade war threats, tariff rants, sticky inflation. Who’s doing the heavy lifting? The Magnificent Seven, mostly. But it’s Nvidia’s chart that’s turned this whole index into a de facto AI ETF.
Is it healthy? That depends. As long as earnings season doesn’t break the dream — and there’s no rug-pull from the Fed — traders are letting the momentum do its thing.
🏦 S&P 500: The Record Chaser
What about the S&P 500 SP:SPX — the broadest barometer of America’s corporate muscle? It rose to set its own record high last week before coming down on Friday on renewed tariff jitters.
The Wall Street darling looks less explosive than its tech-packed peer, the Nasdaq. But it’s still up nearly 7% year-to-date — and up 26% from the April dip when tariffs spooked everyone out of their leveraged longs. Now? It’s back in record territory, brushing aside GDP contraction and inflation that won’t quit.
Why? Because the market is forward-looking. Tariffs may sting, but when the Fed hints at cuts and Trump sticks to his MAGA narrative, risk assets catch a bid.
🧨 What About Those Tariffs, Though?
Speaking of tariffs, let’s not pretend they’re not looming. Trump threatened over the weekend to ramp up levies on EU goods to 30% starting August 1 if no new deal emerges. Canada got an earful too: 35% on certain Canadian exports — and Ottawa announced a $21 billion tit-for-tat.
The “pause” on reciprocal tariffs ends in a few weeks. So, is this noise or real risk?
For now, markets are calling the bluff. Investors have tuned out the saber-rattling, choosing to front-run the Fed’s next move instead. If tariffs spark a deeper trade war, stocks may get a reality check. Until then, the melt-up rules.
🔮 What’s Next? Eyes on Earnings
Earnings season is around the corner (be sure to follow the Earnings Calendar ), and you can bet every fund manager is watching Nvidia NASDAQ:NVDA , Microsoft NASDAQ:MSFT , and the rest of the Mag 7 for cracks in the AI gold rush.
If the big names keep printing double-digit revenue growth, investors should be happy. But any hint of deceleration, cautious guidance, or margin pressure could slam the brakes on this record run.
Your turn : Do you see this melt-up stretching into the second half of the year? Or are we due for a rude awakening once the earnings calls roll in? Drop your take below!
USDJPY 30Min Engaged ( Bearish Entry Detected )————-
➕ Objective: Precision Volume Execution
Time Frame: 30-Minute Warfare
Entry Protocol: Only after volume-verified breakout
🩸 Bearish From now Price :148.750
➗ Hanzo Protocol: Volume-Tiered Entry Authority
➕ Zone Activated: Dynamic market pressure detected.
The level isn’t just price — it’s a memory of where they moved size.
Volume is rising beneath the surface — not noise, but preparation.
🔥 Tactical Note:
We wait for the energy signature — when volume betrays intention.
The trap gets set. The weak follow. We execute.
Mastering supply and demand zones - how to use it in trading?Supply and demand zones are key concepts in technical analysis used by traders to identify potential price reversal areas on a chart. They are based on the idea that prices move due to an imbalance between buyers (demand) and sellers (supply).
-------------------------
What will be discussed?
- What are supply and demand zones?
- How to detect supply and demand zones?
- Examples from supply and demand zones?
- How to trade using supply and demand zones?
-------------------------
What are supply and demand zones?
Supply and demand zones are areas on a price chart where the forces of buying and selling are strongly concentrated, causing significant movements in price. In simple terms, a supply zone is an area where selling pressure exceeds buying pressure, often leading to a drop in price. It usually forms when price moves upward into a region where sellers begin to outnumber buyers, pushing the price back down. On the other hand, a demand zone is a region where buying pressure exceeds selling pressure, typically resulting in a rise in price. This occurs when price moves downward into a region where buyers see value and begin to outnumber sellers, causing the price to increase again.
These zones reflect areas of imbalance in the market. In a supply zone, sellers are more eager to sell than buyers are to buy, often due to overbought conditions, news, or fundamental changes. In a demand zone, buyers are more eager to buy than sellers are to sell, often because the price has become attractive or undervalued. Traders look for these zones because they provide clues about where price may reverse or stall, offering potential entries or exits for trades.
-------------------------
How to detect supply and demand zones?
Identifying supply and demand zones involves analyzing price action on a chart, typically using candlestick patterns. A common way to detect a supply zone is to look for a sharp upward move followed by a sudden reversal or strong drop in price. The area where the price stalled before falling sharply is likely to be a supply zone. This zone includes the highest candle body or wick before the drop, and a few candles before it that mark where the selling pressure began.
To identify a demand zone, you would look for a sharp drop in price followed by a strong rally upward. The area where the price paused before rising significantly can be considered a demand zone. Like with supply zones, the demand zone includes the lowest candle before the price reversed and a few candles leading up to it.
These zones are not exact price levels but rather ranges. Price does not have to touch an exact line to react; it often moves within the general area. For more accuracy, traders often refine their zones by identifying them on higher time frames such as the 4-hour or daily chart, then adjusting them slightly on lower time frames like the 1-hour or 15-minute chart.
-------------------------
Examples from supply and demand zones:
-------------------------
How to trade using supply and demand zones?
Trading supply and demand zones involves anticipating how price is likely to behave when it returns to one of these key areas. A common method is to wait for price to enter a zone and then watch for confirmation that it is going to reverse. For example, if price rises into a supply zone, you might look for signs like a bearish candlestick pattern, a drop in volume, or a rejection wick to signal that sellers are stepping in again. This would be an opportunity to enter a short trade with the expectation that price will fall.
Conversely, if price falls into a demand zone, you would wait for bullish signals—such as a strong bullish candle, a double bottom pattern, or clear rejection of lower prices—to confirm that buyers are returning. This would be a potential setup for a long trade, expecting the price to move up from the zone.
Traders often place stop losses just beyond the zone to limit risk in case the level fails. For a supply zone, the stop loss would go just above the zone, while for a demand zone, it would go just below. Targets can be set at recent support or resistance levels, or by using risk-reward ratios like 1:2 or 1:3 depending on the trader’s strategy.
Patience and discipline are important when trading these zones. Not every zone will lead to a reversal, and false breakouts can occur. Therefore, combining supply and demand analysis with other tools such as trendlines, moving averages, or indicators can improve the chances of a successful trade.
In summary, supply and demand zones help traders understand where large buying or selling forces are likely to influence price. By learning to identify these zones and waiting for confirmation signals, traders can enter high-probability trades with clear risk and reward levels.
-------------------------
Disclosure: I am part of Trade Nation's Influencer program and receive a monthly fee for using their TradingView charts in my analysis.
Thanks for your support. If you enjoyed this analysis, make sure to follow me so you don't miss the next one. And if you found it helpful, feel free to drop a like and leave a comment, I’d love to hear your thoughts!
GOLD → The triangle is contracting. Retest of support...FX:XAUUSD tested a local high of 3375 but quickly returned to consolidation. The reason is manipulation by the US administration related to Powell, inflation, and interest rates...
Demand for gold has risen sharply amid global risks: Trump's aggressive tariff plans, strong inflation, and uncertainty about the Fed's actions have increased interest in defensive assets. Despite the temporary strengthening of the dollar, gold remains a popular hedging instrument. Technical analysis also points to a bullish outlook. However, growth potential is limited until the Fed clarifies its interest rate policy
Technically, on the D1 chart, it is clear that the price is consolidating, with the range continuing to narrow. Due to the bullish factors listed above, we can expect growth to continue. However, it is difficult to say where and when the growth will begin due to the uncertainty factor. All attention is on the support at 3320-3312, the triangle support, as well as the consolidation support at 3287.
Resistance levels: 3365, 3375
Support levels: 3320, 3312, 3287
Since the opening of the session, the price has spent part of its daily range, so there may not be enough potential for the decline to continue. A false breakdown of support and consolidation of the price above the key zone may attract buyers, which will trigger growth towards resistance.
Best regards, R. Linda!
ETH - If You Know ...... You Know whats Coming
NYSE:BLK $BUIDL tokenized U.S.-Treasury fund launched on COINBASE:ETHUSD in Mar 2024—Wall Street is already settling real dollars on-chain.
NYSE:JPM JPMD stablecoin just went live on Base (an COINBASE:ETHUSD L2), piping wholesale payments from a $4 T balance-sheet straight through COINBASE:ETHUSD rails.
COINBASE:ETHUSD isn’t just riding the next crypto cycle—it’s becoming Wall Street’s settlement layer. From BlackRock’s on-chain Treasury fund to JPMorgan’s and soon Bank of America’s dollar tokens, a tidal wave of institutional stable-coin flows is lining up behind ETH. Fewer coins, more real-world volume—if you know, you know what’s coming.
NYSE:BAC CEO says they’ll issue a dollar-backed token the moment regulators nod—another tier-1 bank boarding the Ethereum train.
Stablecoin cap has blasted past $230 B , with 80 %+ of all on-chain transfers riding Ethereum (plus BSC) blocks.
Corporate settlements via stablecoins grew 25 % YoY in 2024 as multinationals replaced SWIFT with instant on-chain clearing.
Daily stablecoin throughput averages $7 B—each hop burning ETH and tightening supply.
BCG projects tokenized real-world assets to exceed $16 T by 2030 , with EVM chains as the default plumbing.
Over 500 M wallets already interact with stablecoins , a 30 % YoY surge led by emerging-market demand.
L2s like BINANCE:ARBUSDT & BINANCE:OPUSDT cut transaction fees 35 % yet still settle back to mainnet—meaning ETH captures the fee stream and the burn.
Bottom line: a tidal wave of bank-grade stablecoins + tokenized assets is lining up behind ETH; supply shrinks, demand soars—if you know, you know what’s coming.
quote] Marty Boots | 17-Year Trader — smash that , hit LIKE & SUBSCRIBE, and share your views in the comments below so we can make better trades & grow together!
BTC Rejection from QML Zone: Towards on 113,600 SupportHello guys!
This chart shows a QML (Quasimodo Level) setup in play on Bitcoin. After price created a new high and engulfed the previous structure, it returned to the QML zone (around $119K–$121K) and reacted exactly as expected: strong rejection.
The sharp selloff from the QML area confirms a bearish shift in structure, and now the momentum is tilted to the downside.
The next key level to watch is the 113,600 demand zone, where the price may either bounce or consolidate.
As long as the price stays below the QML zone, bears have control.
You should consider that the main trend is bullish, and the stop loss may be hit, so please manage your risk!
2/ Altseason: Live - My Coin-Picking StrategyThe "Altseason: Live" experiment has unofficially begun. While many are debating if altseason will happen at all, I prefer to act. We may not see a classic, market-wide surge across all coins. The market has changed. But I believe that targeted, explosive opportunities always exist.
In this post, I won't be giving signals. I will share something much more valuable- my methodology for selecting coins for this final push. This is the exact approach I'm using right now.
Principle #1: Finding the 'Right' Cycle
I've long observed how major players profit from altcoin cycles. In every asset that shows exponential growth, I almost always see three distinct phases: Pre-Pump, Pump, and Super-Pump.
This isn't chaotic growth; it's a managed process. We've seen numerous examples over the past year. Let's look at the RSR chart as a textbook example of such a cycle.
My task is to find coins that have completed their accumulation phase and are now in the "Pre-Pump" stage.
Principle #2: Detecting the 'Footprints' of a Major Player
How can you tell if a major player is in a coin and ready to make a move? I look for what I call "candles with long wicks."
When you see an abnormally long lower wick on a chart with increased volume, it often means one thing: someone is trying to buy a large amount, but there isn't enough liquidity in the order book. The price drops, they sweep up everything available, and the price snaps back up.
For me, this is a clear sign—there's a "whale" here. They are defending their level and continuing to build a position to distribute at much higher prices.
Principle #3: Risk Management and the First Trades
Based on these two principles, I've gone through my extensive watchlist and selected my first targets. My choice fell on MAV and RONIN. On their charts, I saw the exact patterns I was looking for.
I want to be perfectly honest: this is aggressive trading. To achieve my ambitious goal, I will be taking risks. But I am only risking an amount that I am mentally prepared to lose. You have to understand: this is the crypto market, these are altcoins, often with low liquidity, and this is all happening on centralized exchanges. The risks are maximal.
What's Next?
The goal is set. The first steps have been taken. I will try to act carefully but decisively.
I'm documenting every step of this experiment. You'll be able to see everything with your own eyes, including my real PnL and open positions, on my regular livestreams.
Thank you for your attention. Fasten your seatbelts; we're taking off.
Best regards EXCAVO
EUR/USD - Daily Chart (Wedge Breakout) (16.07.2025) The EUR/USD Pair on the D1 timeframe presents a Potential Selling Opportunity due to a recent Formation of a Wedge Pattern. This suggests a shift in momentum towards the downside in the coming Days.
Possible Short Trade:
Entry: Consider Entering A Short Position around Trendline Of The Pattern.
Target Levels:
1st Support – 1.0956
2nd Support – 1.0625
💡 Fundamental & Sentiment Context
Euro under pressure amid renewed concerns over EU‑US trade friction .
The USD is strengthening, supported by safe‑haven flows amid tariff uncertainties.
🎁 Please hit the like button and
🎁 Leave a comment to support for My Post !
Your likes and comments are incredibly motivating and will encourage me to share more analysis with you.
Best Regards, KABHI_TA_TRADING
Thank you.
Disclosure: I am part of Trade Nation's Influencer program and receive a monthly fee for using their TradingView charts in my analysis.
ETHUSD 1h Bullish Reversal SetupChart Analysis Summary:
Current Price:
$3,429.21 (at the time of the screenshot)
Trend:
Strong uptrend within a bullish ascending channel.
Price has been respecting the trendline and moving upward steadily.
Key Chart Patterns & Tools:
Ascending Channel: ETH is trading within an upward sloping channel, suggesting bullish momentum.
Ichimoku Cloud (green): Price is trading well above the cloud, reinforcing bullish sentiment.
Breakout Structure: The chart shows a small consolidation/pullback with a projected bullish breakout.
📈 Key Levels:
Type Price Level (USD) Notes
Current 3,429.21 Live price
Resistance 1 3,506.17 Minor resistance
Resistance 2 3,519.55 Immediate breakout target
Final Target 3,650.71 Major resistance and potential price objective
🧭 Price Action Forecast:
If ETH holds above $3,429 and breaks above $3,519.55, the path toward $3,650 remains open.
A small pullback (as indicated by the blue arrow) is expected before continuation.
As long as price remains within or near the ascending channel, the bullish scenario .
✅ Bullish Confirmation:
Break and retest of $3,519.55.
Continued support above the Ichimoku cloud.
Holding the trendline from the ascending channel.
Daily CLS I Model O I CLS low will be visited...Yo Market Warriors ⚔️
Fresh outlook drop — if you’ve been riding with me, you already know:
🎯My system is 100% mechanical. No emotions. No trend lines. No subjective guessing. Just precision, structure, and sniper entries.
🧠 What’s CLS?
It’s the real smart money. The invisible hand behind $7T/day — banks, algos, central players.
📍Model 1:
HTF bias based on the daily and weekly candles closes,
Wait for CLS candle to be created and manipulated. Switch to correct LTF and spot CIOD. Enter and target 50% of the CLS candle.
For high probability include Dealing Ranges, Weekly Profiles and CLS Timing.
Analysis done on the Tradenation Charts
Disclosure: I am part of Trade Nation's Influencer program and receive a monthly fee for using their TradingView charts in my analysis.
Trading is like a sport. If you consistently practice you can learn it.
“Adapt what is useful. Reject whats useless and add whats is specifically yours.”
David Perk aka Dave FX Hunter
💬 Comment with requests for analysis, just post instrument. I will answer with my opinion.
Gold 30Min Engaged ( Bullish Reversal Entry Detected )Time Frame: 30-Minute Warfare
Entry Protocol: Only after volume-verified breakout
🩸Bullish Reversal 3329 Zone
➗ Hanzo Protocol: Volume-Tiered Entry Authority
➕ Zone Activated: Dynamic market pressure detected.
The level isn’t just price — it’s a memory of where they moved size.
Volume is rising beneath the surface — not noise, but preparation.
🔥 Tactical Note:
We wait for the energy signature — when volume betrays intention.
The trap gets set. The weak follow. We execute.
☄️Gold 30Min Engaged ( Bearish Reversal Entry Detected )
AUDNZD: Ongoing Reversal from ResistanceI am watching for a reversal on AUDNZD as marked on my chart, expecting a reversal with a downside target at around 1.08700.
This is a high probability setup taken into account the overextended upside move to this resistance zone.
Just sharing my thoughts for the charts, this isn’t financial advice. Always confirm your setups and manage your risk properly.
XUA/USD) Bearish Analysis Read The captionSMC trading point update
Technical analysis of XAU/USD (Gold vs USD) on the 1-hour timeframe. Here's a breakdown
Technical Analysis Summary
1. Descending Channel:
The price is moving within a clear descending channel, indicating a bearish market structure.
Recent price action rejected the upper boundary of the channel, strengthening the downtrend bias.
2. Resistance Rejection:
A key resistance level around 3,340–3,345 was retested (marked with a red arrow) and rejected.
Price has already shown early bearish candles post-rejection, suggesting weakness at that level.
3. 200 EMA (Exponential Moving Average):
Price is currently hovering around the 200 EMA, and a clean break below it could accelerate the bearish move.
4. RSI Indicator:
RSI is around 46, below neutral 50, showing bearish momentum is building but not yet oversold.
No divergence is present, supporting the idea of continuation.
---
Bearish Playbook
Entry Idea: After the rejection at the resistance zone and confirmation of lower highs.
Target: 3,313 – 3,310 zone (marked as the “key support level” and “target point”).
Risk Management: A stop loss above 3,345 (above the resistance zone) would be a prudent protection level.
---
Confluences Supporting the Short Setup:
Rejection at horizontal resistance.
Alignment with the descending trendline/channel.
Price trading near or below the 200 EMA.
RSI slightly bearish.
Caution:
Watch out for any macroeconomic news or high-impact events (highlighted with the economic event icons) that could inject volatility.
A strong break back above the resistance could invalidate this bearish setup.
Mr SMC Trading point
Conclusion:
This setup anticipates a bearish continuation targeting the 3,310 support zone. Ideal for short-term traders looking for downside opportunities, provided price respects the trend and fails to reclaim the resistance.
Please support boost 🚀 this analysis)
#XAUUSD(GOLD): Strong Sellers Hold, Further Drop Incoming! God dropped from our area of entry yesterday as we initially expected. However, since the massive drop, we are now seeing some short-term correction in the prices. In the coming time, we can expect further price drops around 3280 or 3250.
If you like our idea, please like and comment.
Team Setupsfx_