GOLD → Retest of consolidation resistance. Chances of a breakoutFX:XAUUSD bounces off support at 3312, forming a false breakdown at 3320. The price is heading towards consolidation resistance. The chances of continued growth are increasing...
Gold rebounded from its low amid statements by Fed member Waller about a possible rate cut in July. However, strong US sales and labor market data strengthened the dollar and held back XAU/USD growth. Despite statements by some Fed members about maintaining a tight policy, traders continue to expect rate cuts before the end of the year. The focus is on new economic data that could affect the dollar and gold prices.
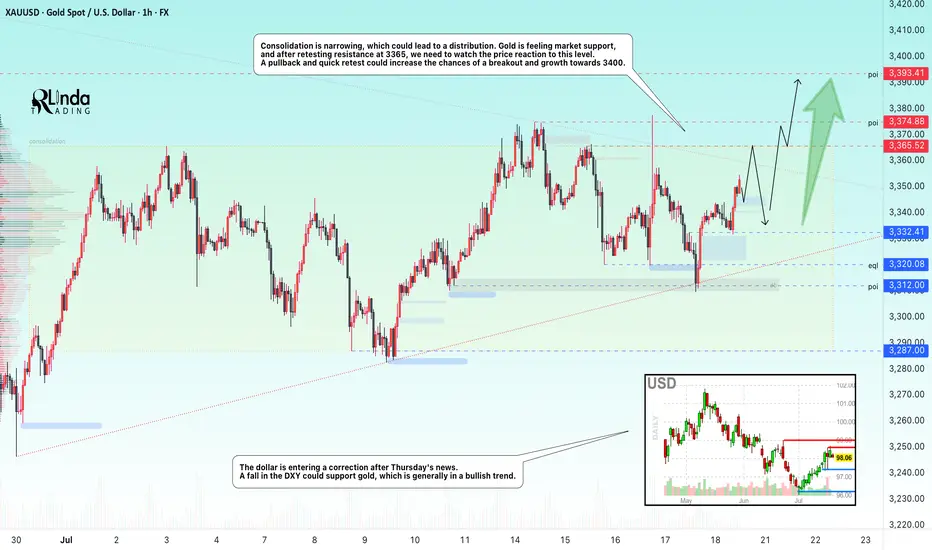
Technically, consolidation is narrowing, which could lead to distribution. Gold is feeling market support, and after retesting resistance at 3365, we need to watch the price reaction to the level. A pullback and quick retest could increase the chances of a breakout and growth to 3400.
Resistance levels: 3365, 3375
Support levels: 3332, 3320, 3312
There is a high probability that there will be an attempt to break through the consolidation resistance amid expectations of a rate cut. This phase may be accompanied by either a correction to retest and return for a breakout, or a breakout and consolidation of the price above the level. Today, Friday, I expect a retest and correction, as there may not be enough local potential for a breakout of this level, and the price has already lost some of its momentum since the opening of the session...
Best regards, Linda!
Elliott Wave
USDJPY Potential UpsidesHey Traders, in today's trading session we are monitoring USDJPY for a buying opportunity around 148.500 zone, USDJPY for a buying opportunity around 148.500 zone, USDJPY is trading in an uptrend and currently is in a correction phase in which it is approaching the trend at 148.500 support and resistance area.
Trade safe, Joe.
GOLD → The triangle is contracting. Retest of support...FX:XAUUSD tested a local high of 3375 but quickly returned to consolidation. The reason is manipulation by the US administration related to Powell, inflation, and interest rates...
Demand for gold has risen sharply amid global risks: Trump's aggressive tariff plans, strong inflation, and uncertainty about the Fed's actions have increased interest in defensive assets. Despite the temporary strengthening of the dollar, gold remains a popular hedging instrument. Technical analysis also points to a bullish outlook. However, growth potential is limited until the Fed clarifies its interest rate policy
Technically, on the D1 chart, it is clear that the price is consolidating, with the range continuing to narrow. Due to the bullish factors listed above, we can expect growth to continue. However, it is difficult to say where and when the growth will begin due to the uncertainty factor. All attention is on the support at 3320-3312, the triangle support, as well as the consolidation support at 3287.
Resistance levels: 3365, 3375
Support levels: 3320, 3312, 3287
Since the opening of the session, the price has spent part of its daily range, so there may not be enough potential for the decline to continue. A false breakdown of support and consolidation of the price above the key zone may attract buyers, which will trigger growth towards resistance.
Best regards, R. Linda!
Bitcoin Bearish Shark Detected – CME Gap Below $115K in Sight?Today's analysis is on the 15-minute timeframe , following the previous analysis I shared with you on the 1-hour timeframe .
Bitcoin ( BINANCE:BTCUSDT ) is currently trading in the Resistance zone($120,100-$118,240) near the Potential Reversal Zone(PRZ) and Cumulative Short Liquidation Leverage($121,490-$119,965) .
From a technical perspective , it looks like Bitcoin is completing the Bearish Shark Harmonic Pattern on the 15-minute timeframe .
From an Elliott wave theory perspective, it looks like Bitcoin is completing the microwave 5 of wave C of the Zigzag Correction(ABC/5-3-5) .
I expect Bitcoin to start falling from the top of the ascending channel and at least decline to the lower line of the descending channel, and if the ascending channel breaks this time, we should wait for the CME Gap($117,255-$116,675)/CME Gap($115,060-$114,947) to fill.
Cumulative Long Liquidation Leverage: $117,556-$116,465
Cumulative Long Liquidation Leverage: $115,773-$114,513
Do you think Bitcoin can create a new ATH again?
Note: Stop Loss(SL)= $121,620
Please respect each other's ideas and express them politely if you agree or disagree.
Bitcoin Analyze (BTCUSDT), 15-minute time frame.
Be sure to follow the updated ideas.
Do not forget to put a Stop loss for your positions (For every position you want to open).
Please follow your strategy and updates; this is just my Idea, and I will gladly see your ideas in this post.
Please do not forget the ✅' like '✅ button 🙏😊 & Share it with your friends; thanks, and Trade safe.
GBPCHF → Retest of resistance to the global downtrendFX:GBPCHF is facing resistance from the local trend, which is aligned with the global bearish trend. The trend may continue...
A retest of resistance is forming within the global downtrend. As part of the correction, the price is testing the zone of interest and, after a false breakout of 1.7935, is returning to the selling zone.
The currency pair is rebounding from the resistance of the local trend, which coincides with the global trend. Consolidation of the price below 1.078 may trigger a continuation of the decline
Resistance levels: 1.07932, 1.0823
Support levels: 1.07744, 1.07255
Price consolidation in the selling zone followed by a break of the local structure could strengthen the bearish sentiment, which could trigger a further decline overall.
Best regards, R. Linda!
Bitcoin Technical Setup: Support Holds, Eyes on $118,600Bitcoin ( BINANCE:BTCUSDT ) moved as I expected in the previous ideas and finally completed the CME Gap($117,255-$116,675) in the last hours of the week. ( First Idea _ Second Idea )
Before starting today's analysis, it is important to note that trading volume is generally low on Saturday and Sunday , and we may not see a big move and Bitcoin will move in the range of $121,000 to $115,000 ( in the best case scenario and if no special news comes ).
Bitcoin is currently trading near the Support zone($116,900-$115,730) , Cumulative Long Liquidation Leverage($116,881-$115,468) , Potential Reversal Zone(PRZ) , and Support lines .
According to Elliott Wave theory , Bitcoin had a temporary pump after the " GENIUS stablecoin bill clears House and heads to Trump's desk " news, but then started to fall again, confirming the end of the Zigzag Correction(ABC/5-3-5) . Now we have to wait for the next 5 down waves or the corrective waves will be complicated .
I expect Bitcoin to rebound from the existing supports and rise to at least $118,600 . The second target could be the Resistance lines .
Do you think Bitcoin will fill the CME Gap($115,060-$114,947) in this price drop?
Cumulative Short Liquidation Leverage: $121,519-$119,941
Do you think Bitcoin can create a new ATH again?
Note: Stop Loss(SL)= $114,700
Please respect each other's ideas and express them politely if you agree or disagree.
Bitcoin Analyze (BTCUSDT), 15-minute time frame.
Be sure to follow the updated ideas.
Do not forget to put a Stop loss for your positions (For every position you want to open).
Please follow your strategy and updates; this is just my Idea, and I will gladly see your ideas in this post.
Please do not forget the ✅' like '✅ button 🙏😊 & Share it with your friends; thanks, and Trade safe.
Short - AMDTime period for this play : week to months
Analysis : Elliot wave 12345 ABC. Expect hitting .618 and bounce back up to go higher.
Pattern if wave B completed : Head & Shoulder
Price Target: Wave ABC
ETA Timeline for correction. Please refer to the chart.
Upcoming events:
Tariff active on 8/1/25 - Friday
Earning on 8/5/25 - Tuesday
Top is not in yet, so 2 Possible top-in levels:
Top 1 - $163.45 : Retesting to hit 163.45, rejected, and break $158
Top 2 - $173.94 : Breaking 163.45 and reject at 173.94
=> Overall, It begins trading side way and show some weakness now.
The correction may not pull back to .618, which is the best level. Other scenarios:
- 0.5 fib, where it test wave 3
- 0.328 fib, strong bullish level if it doesn't break & go to the upside faster
EURAUD → Correction for accumulation before growthFX:EURAUD reaches the zone of interest during a correction and forms a false breakdown of local support. Traders can switch to the buy side to support the trend.
Against the backdrop of a global bullish trend and a correction in the euro, the currency pair is following this movement, the essence of which is to consolidate funds for further growth. Liquidation is forming in relation to the liquidity zones of 1.785, 1.78, and 1.773, and the market imbalance is changing. The current movement is bringing the price to the zone of interest: the liquidity area of 1.773 and the order block. The capture of liquidity relative to 1.773 leads to the formation of a false breakdown and a pullback to the area of interest for buyers. Accordingly, price consolidation above 1.776 and 0.7 Fibonacci could support the main trend and allow the price to strengthen.
Support levels: 1.776, 1.773, 1.763
Resistance levels: 1.786, 1.795
The euro clearly demonstrates an upward trend, the structure of which has not been broken during the correction. Correction is a perfectly healthy movement within a trend, allowing positions to be opened at more favorable prices. If the bulls hold their defense above 1.776, momentum towards the specified targets may form.
Best regards, R. Linda!
EURUSD is Nearing an Important Support!!Hey Traders, in today's trading session we are monitoring EURUSD for a buying opportunity around 1.15400 zone, EURUSD is trading in an uptrend and currently is in a correction phase is in a correction phase in which it is approaching the trend at 1.15400 support and resistance area.
Trade safe, Joe.
FDAX Today 1. Wave (3) likely near completion:
Price hit the 1.618 extension of Wave 1, which is textbook for a Wave 3 target.
There’s also confluence with the 23.6% retracement from the previous swing high (24,703), and we're near a Bearish FVG + Order Block zone.
High-probability zone for a short-term rejection or distribution top.
2. Wave (4) could start today
If Wave 3 is topping into OpEx, dealers might unwind long gamma hedges, contributing to volatility + pullback.
XRP → ATH retest. Reversal or continued growth?BINANCE:XRPUSDT.P is rallying and ready to test the resistance zone - ATH. Against this backdrop, Bitcoin is consolidating after a bull run. The liquidity pool may hold back growth.
Fundamentally, there is excitement across the entire cryptocurrency market. Altcoins are rallying after Bitcoin hit a new high and entered consolidation. The BTC.D index is declining, which generally provides a good opportunity for altcoins to grow. However, the index is approaching technical support, which may affect market sentiment overall...
As for XRP, there is a fairly strong liquidity pool ahead — the ATH resistance zone. The price is in a distribution phase after a change in character and a breakout of the downtrend resistance in the 2.33 zone. The momentum may exhaust its potential to break through the 3.35-3.34 zone, and growth may be halted for correction or reversal (in correlation with Bitcoin's dominance in the market).
Resistance levels: 3.35-3.40
Support levels: 3.0, 2.64
A breakout of resistance without the possibility of further growth, a return of the price below the level (i.e., inside the global flat) will confirm the fact of a false breakout of resistance, which may trigger a correction or even a reversal.
Best regards, R. Linda!
$HBAR Pull Back Started, What is the target?CRYPTOCAP:HBAR doing extremely well, the R5 daily pivot point has been hit and a pull back should be expected before continuation!
It appears wave 3 is now complete and wav4 i expected to pull back to the 0.382 Fibonacci retracement which adds confluence to the High Volume Node in the same place at $0.22 our previous take profit #2 target.
Daily RSI is overbought but no bearish divergence yet! Price behaviour can often pop above the swing high just made to trap new buyers before dumping hard! Watch out for that, that would be the bearish divergence print also.
The next take profit is $0.39
Safe trading
XLM Explodes +132% — Is the Party Over or Just Starting?XLM has been one of the top movers, sweeping the January 2025 swing high at $0.515 before stalling and moving sideways for the past 4 days.
Is XLM gearing up for another push toward the highs, or is a correction imminent?
Let’s dive into the details.
🧩 Market Structure & Fractal Pattern
XLM skyrocketed +132% in just 13 days, mirroring the explosive move seen back in November 2024.
If we apply the November fractal, the current price action suggests we could be setting up for an ABC corrective move.
📉 Key Levels & Confluences
FVG Zone: ~$0.49–$0.50 — likely to be swept before any major move down.
Monthly Support: $0.4142
Key Level / Liquidity Pool: $0.4056 — likely cluster of stop-losses.
Anchored VWAP (from $0.2228 start of trend): currently near $0.4056, adding strong confluence.
1.0 Trend-Based Fib Extension (ABC projection): If price pushes to ~$0.49 to complete wave B, the projected 1.0 TBFE for wave C lands right on the $0.4056 key level + VWAP, creating a perfect confluence zone.
➡️ Conclusion: The $0.4142–$0.4056 zone is a critical support and liquidity area with multiple confluences lining up.
Trade Setups
🔴 Short Setup:
Entry zone: $0.48–$0.50 (ladder in)
Stop-loss: Above $0.5166 (prior high)
Take-profit: $0.4142–$0.4056 zone
R:R ≈ 1:3
🟢 Long Setup:
Entry zone: $0.4142–$0.4056 (preferably near VWAP)
Stop-loss: Below $0.395
Take-profit: $0.44
⚡ Final Thoughts
Watch for a potential final push toward $0.49–$0.50 before a corrective wave unfolds.
The confluence at the $0.4142–$0.4056 zone — including monthly/weekly levels, VWAP, liquidity pool, and the 1.0 TBFE target — makes it a key area for decision-making.
Stay patient and wait for confirmation at these levels. Will post an update as things unfold!
_________________________________
💬 If you found this helpful, drop a like and comment!
Want breakdowns of other charts? Leave your requests below.
New Highs Ahead?In recent sessions, Nio Inc. has shown a price acceleration consistent with a Minor degree impulsive wave, as outlined by Elliott Wave Theory. Wave 1 has extended by a factor of 1.39, and the current price structure suggests a possible completion of Wave 3 and an early development of Wave 5, with clear technical targets already in place.
This technical scenario aligns with recent positive developments on the fundamental side:
🔹 Stronger delivery numbers – The latest quarterly results reveal robust year-over-year growth in vehicle deliveries, highlighting the company’s ability to scale production and meet rising demand. This performance is further enhanced by an improved product mix, with a shift toward higher-end or newer models, which contributes to stronger revenue per unit and improved brand positioning.
🔹 Battery swap network expansion – The company is steadily expanding its battery swap infrastructure. This innovative model, which allows EV drivers to swap a depleted battery for a fully charged one in just a few minutes, differentiates the company from traditional EV players. It also reduces charging time anxiety, increases convenience, and aligns with long-term goals for energy and fleet efficiency—particularly in dense urban areas and high-mileage use cases like ride-hailing or logistics.
🔹 New market entries – The company is actively pursuing international expansion, with strategic launches in Europe, including growing presence in countries like Germany, the Netherlands, and Norway. At the same time, it's establishing key partnerships in the Middle East to prepare for future entry into high-potential markets such as the UAE and Saudi Arabia. This geographic diversification not only broadens the customer base but also strengthens global brand positioning in the premium EV segment.
🔍 Key Highlights – NIO Mid-2025 Update
📈 Vehicle Deliveries
June 2025: 24,925 vehicles delivered (+17.5% YoY)
Q2 2025: 72,056 vehicles (+25.6% YoY)
1H 2025 total: 114,150 units (+30% YoY)
Cumulative deliveries: 785,714 units as of June 30, 2025
🔋 Battery Swap Network
Global footprint: Over 2,700 stations (2,400+ in China, ~60 in Europe)
China: ~2,651 stations, with 159 in Shanghai
Europe: ~60 stations, notably in Germany and Norway
Utilization: Peak stations in Shanghai exceed 100 swaps/day; global average ~30–40
💡 Takeaway
These strong operational metrics confirm accelerating growth and strategic infrastructure expansion, reinforcing NIO’s unique value proposition in the EV sector. The fundamental momentum aligns with bullish technical signals, including an unfolding Elliott Wave pattern projecting higher targets.
Based on the current Elliott Wave projection:
Minimum target for Wave 3: 5.64
Projected Wave 5 range: between 7.58 and 8.90
In summary, we’re observing a technically and fundamentally aligned scenario where price action is increasingly supported by improving financials and strategic execution on the ground.
This is not a financial advise, please do your own research.
XRP Special UpdateJust wanted to give y'all a heads up that XRP is within the target box for (5) of ((3)). If you look up my old posts from March and even as far back as January, you will see I have not changed this chart at all. It is doing exactly what the pattern had been telling us it would. I went ahead and sold the rest of my position, so I am now flat XRP. Will it move higher still yet? I believe it will, yes. However, it could turn around very soon so I found it better to collect my profits while I had the opportunity. A wise man once said, "profit is a thief, take it while you can." Don't get greedy in this game, or you will come to regret it!
FYI: I think the 1.382 is a reasonable place for this pattern to end. If we can get a 3-wave retracement, there is a high probability I re-enter with tight stops for another leg higher.
GBPJPY Large Reversal Pattern [Elliott Wave]Executive Summary:
GBPJPY shaping a diagonal pattern.
Large bearish reversal could push down to 184.
Above 202.40 voids the pattern as labeled.
I typically don't conduct Elliott wave analysis on cross pairs simply because they are the children of the two main currencies involved. GBPJPY is the child of GBPUSD and USDJPY.
With that said, I still scroll through charts looking for compelling patterns and GBPJPY caught my attention.
First, it's knocking on the door of 200...a nice round number.
Secondly, the rally from 184 in April to now appears to be a very mature Elliott wave ending diagonal pattern .
Diagonals shape in 5 waves. Remember, wave 3 cannot be the shortest of waves 1,3,5. Since wave 3 is shorter than wave 1, that means wave 5 cannot be longer than wave 3.
So we simply measure out wave 3 and apply it to the end of wave 4, and, voila, we have a maximum target for wave 5 at 202.40 .
That maximum target doesn't mean GBPJPY has to go that high, but this market is ripe for a large bearish turn. If GBPJPY does push above 202.40, then my wave labeling is incorrect.
Ending diagonals tend to be fully retraced which implies a decline back to 184 ... 1500 pips from today's price.
GBJPY may dance around in the 199 handle for a day or two.
A break below 199 could be an early warning signal of the bearish reversal. A break below the blue support trend line helps confirm the pattern.
If this bearish reversal takes hold, then GBPUSD or USDJPY likely experiences a large decline too.
EUR/USD – Bearish Setup as Wave C Unfolds Toward 1.1523📉 EUR/USD – Bearish Setup as Wave C Unfolds Toward 1.1523
Price has retraced into the key 78.6% fib zone after completing Wave B. With clear rejection from the supply area and lower highs forming, Wave C is now in play. Expecting bearish continuation with potential downside targets around 1.1523.
🔻 SHORT BIAS (Wave C in Play)
📍 Entry Zone: 1.16530–1.16945
🎯 Target: 1.15285
⛔ Invalidation: Above 1.17023
📊 Timeframe: 4H
📈 Pattern: ABC Zig-Zag Correction
📌 Updated Analysis by: @greenfire_forex
🧠 Note: Wait for confirmation before entering. Risk management is key.
#EURUSD #ElliottWave #BearishSetup #ABCPattern #WaveC #PriceAction #ForexAnalysis #TradingView
---
Let me know if any correction , would like to suggest
Elliott Wave Analysis: SPY Poised To Extend Higher In Bullish SeElliott Wave sequence in SPY (S&P 500 ETF) suggest bullish sequence in progress started from 4.07.2025 low. It expects two or few more highs to extend the impulse sequence from April-2025, while dips remain above 6.23.2025 low. SPY ended the daily corrective pullback in 3 swings at 480 low on 4.07.2025 low from February-2025 peak. Above there, it favors upside in bullish impulse sequence as broke above February-2025 high. Currently, it favors wave 3 of (1) & expect one more push higher from 7.16.2025 low in to 630.31 – 651.1 area before correcting in wave 4. In 4-hour, it placed 1 at 596.05 high, 2 at 573.26 low as shallow connector & extend higher in 3. Within 3, it placed ((i)) at 606.40 high, ((ii)) at 591.89 low, ((iii)) at 627.97 high & ((iv)) at 618.05 low.
In 1-hour above ((ii)) low of 591.89 low, it ended (i) at 605.96 high, (ii) at 603.17 low, (iii) at 626.87 high as extended move, (iv) at 620 low & (v) as ((iii)) at 627.97 high. Wave ((iv)) ended in 3 swing pullback as shallow connector slightly below 0.236 Fibonacci retracement of ((iii)). Within ((iii)), it ended (a) at 619.8 low, (b) at 624.12 high & (c) at 618.05 low on 7.16.2025 low (this week). Above there, it favors rally in ((v)) of 3 targeting in to 630.31 – 651.1 area before correcting in 4. Within ((v)), it placed (i) at 624.73 high, (ii) at 623.08 low & favors upside in (iii) of ((v)). We like to buy the pullback in clear 3, 7 or 11 swings correction at extreme area in 4 and later in (2) pullback, once finished (1) in 5 swings.
Bitcoin Struggles Below $120K:Will the CME Gap Pull Price Lower?Bitcoin ( BINANCE:BTCUSDT ) has been experiencing a high momentum bullish trend in recent days, which few people expected, especially when it crossed $120,000 . However, in the past 24 hours , Bitcoin has fallen back below $120,000 .
Bitcoin is currently trading in the Resistance zone($119,720-$118,240) and Cumulative Short Liquidation Leverage($118,757-$117,829) on the 1-hour time frame .
In terms of Elliott Wave theory , Bitcoin appears to be completing a main wave 4 . Main wave 4 is likely to have a Zigzag Correction(ABC/5-3-5) .
I expect Bitcoin to attack the Support lines and fill the CME Gap($115,060-$114,947) in the next hour.
Cumulative Short Liquidation Leverage: $123,087-$120,922
Cumulative Long Liquidation Leverage: $116,305-$114,325
Do you think Bitcoin can create a new ATH again?
Note: Stop Loss(SL)= $121,000
Please respect each other's ideas and express them politely if you agree or disagree.
Bitcoin Analyze (BTCUSDT), 1-hour time frame.
Be sure to follow the updated ideas.
Do not forget to put a Stop loss for your positions (For every position you want to open).
Please follow your strategy and updates; this is just my Idea, and I will gladly see your ideas in this post.
Please do not forget the ✅' like '✅ button 🙏😊 & Share it with your friends; thanks, and Trade safe.
Gold elliot wave countMarket Structure – Corrective Wave 2 Still in Progress
We're currently in a Wave 2 correction, unfolding as a classic ABC structure – labeled with Circle A → Circle B → Circle C.
✅ Circle A and Circle B are already complete.
We're now in the move from Circle B → Circle C, which itself is unfolding as a:
→ (A) → (B) → (C) (in parentheses)
Currently, we are in the move from (B) to (C), which again is breaking down as a smaller A → B → C move.
🔍 Key Levels to Watch:
📈 We might now be completing Wave A of (C) around the 3362 level.
🔁 A pullback to around 3322 could follow as Wave B,
➡️ leading to a final Wave C (of (C), of Circle C, completing Wave 2) targeting around 3405.
⏳ What’s Next?
Once we hit the 3405 zone, that would potentially complete the entire Wave 2 correction.
From there, I expect a trend reversal to the downside, beginning the next impulsive wave down.