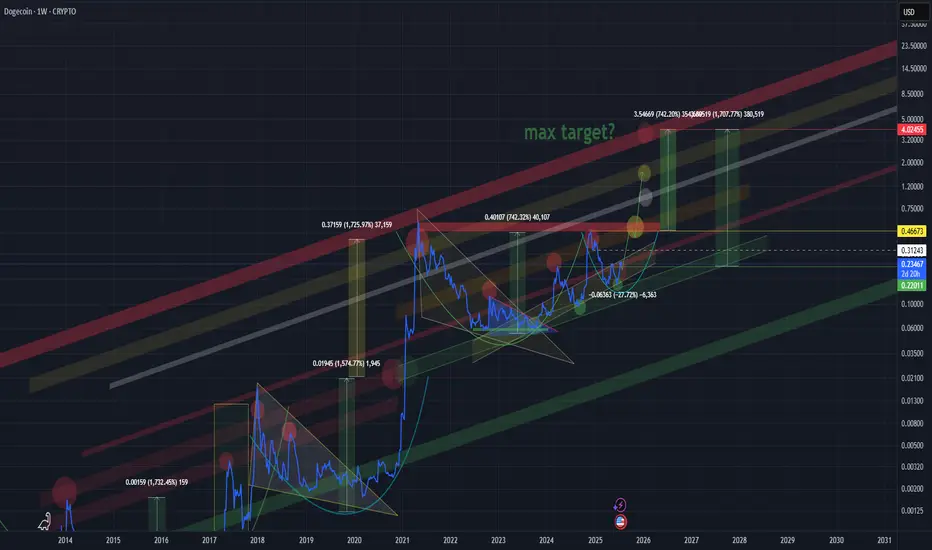
DOGE DOGECOIN DOGEUSDT long/midium term☕ Cup and Handle Forming Again – Targeting $4!
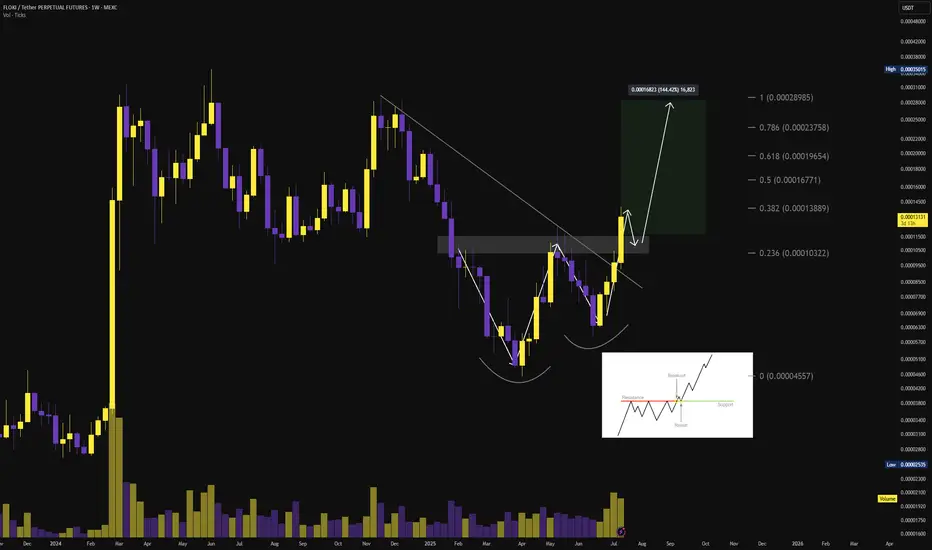
Just like before — we are seeing a massive “Cup and Handle” pattern forming.
Last time, the exact same structure played out, and the price perfectly reached the previous high upon completion of the pattern.
📌 Current Setup
The cup is already formed, and now we are clearly drawing the handle
If history repeats — and it often does in crypto — the price should break out and target above the previous high
🎯 Projected Target:
Based on the structure, the full Cup & Handle breakout points toward a move up to $4.
⚠️ Things to watch
Fakeouts are possible, so use proper risk management
💬 "Patterns don’t repeat exactly — but they often rhyme."
Let the chart guide your plan, not emotions.
Crypto market
XRP Retests Previous All-Time High as Bullish Setup DevelopsFenzoFx—XRP (Ripple) is tested and has stayed above $3.40, the previous all-time high. This level acts as support, backed by the VWAP from Thursday's low and the bullish FVG.
If this level holds, we expect the cryptocurrency to aim higher, targeting $3.60, followed by $3.66.
Cosmos (ATOM) Trading At Bottom · Bear Markets End ForeverCosmos is still trading near its market bottom, the "opportunity buy zone" as I call it. This is nothing more than great news.
Remember how I mentioned that some pairs are really advanced, trading already very high and this is risky if you want to go LONG? Well, when projects are trading near the bottom of the range; support, all-time lows, this is great news because there is little room for lower and plenty of room for prices to grow. ATOMUSDT is now in this highly desirable situation.
This a trading pair that is "yet to move."
It is awesome.
Potential for growth goes beyond the chart, literally. The chart you are seeing here now does not show the potential ATOMUSDT has for growth. The size of the candles should tell you everything you need know.
Bullish waves, corrections, bullish waves and corrections and see how small the candles are. Compare to the action in 2021 and you know we are looking at a true bottom. This opportunity does not repeat often and with the market evolving as it is evolving now, this might be the last chance in the history of Cryptocurrency to buy this low.
This is because we are entering an extended bull market that will last for years to come. When a new bear market develops, a long-term correction, it will be nothing like before. Instead of down, down, down forever, we will have some sideways then down, a strong swing followed by a recovery and additional growth. Just like Bitcoin. Look at Bitcoin since November 2022, that is how most of the big altcoins projects will evolve.
The wild-wild west of Crypto is going to an end. Think of it this way, Cryptocurrencies credit application has been approved.
Remember how the bear markets became shorter and the bull markets longer when the Federal Reserve came into the picture in the early 20th century? That is because with credit easily available, there was no more need for the companies to crash nor take a long time to recover from a major downturn. Here the situation is the same.
With the Cryptocurrency market now being accepted as the amazing technology that it is, we have access to credit. Instead of long and wild crashes, we will have short-term corrections. In short, demand will be too strong for the market to stay depressed for too long.
There will always be corrections of course, night and day (market cycles), but from now on, these will be short.
Namaste.
Ethereum – Calm Before the Next Leg Up?Ethereum had a disappointing start in 2025.
After pushing above $4,000 in mid-December 2024 — with headlines full of "$10K ETH coming!" — the new year began around $3,500, and what followed was a slow bleed.
By early April, Ethereum printed a shocking low at $1,380 — a level few believed was even possible.
But the bounce from there? ⚡
It was explosive — nearly +100% in just one month, with price topping around $2,700.
Since then, we’ve been consolidating — and that’s completely normal after such a vertical move.
🔍 So, what’s next?
Technically, ETH is forming a rectangle, a structure that often resolves as a continuation pattern.
The spike down to the $2,300 zone on May 19th was telling — buyers stepped in aggressively and pushed price back above $2,500, which now acts as a comfort zone for bulls.
📌 Conclusion
I’m looking to buy dips, ideally near $2,550, and my target is the $3,500 zone.
No need to reconsider the bullish outlook as long as price holds above $2,300.
C/USDTRecently, we've seen a strong trend of newly launched coins securing listings on top-tier exchanges, backed by solid projects and experienced teams. C/USDT is no exception after topping out at the $0.25–$0.26 range, the price has pulled back and is currently consolidating within the $0.125–$0.135 zone. This range is shaping up as a strong accumulation base, showing early signs of reversal.
BTC - Calling the Start of the Bearish SeasonHello Watchers ☕
This was my previous Bitcoin update where I had a target of $116K, and also then closed all open positions at $122K:
I'm calling the top here mainly because of the way the chart looks, it really is classic Wyckoff if you look at the duration of the current bullish cycle, which has lasted a whole 973 Days with a 564% increase. What goes up, must come down!
Just for interest sake, the previous bullish cycle ran for 600 days with a 700% increase.
Smart Money Trap or Final Push? | XRPUSD Ready for Rejection Professional XRPUSD Analysis (18 July 2025)
XRPUSD has shown a parabolic move recently, tapping into a high-probability resistance zone between $3.80 – $3.89, an area where liquidity likely sits for institutional players. Price reacted strongly upon entry, suggesting buy-side liquidity was swept and now potential distribution is in play.
🔑 Key Zones:
Resistance: $3.80 – $3.89 (potential reversal zone)
Target (Short-Term): $3.17
Strong Support: $1.80 – $2.00
🧠 Smart Money Perspective:
Market Structure Break (MSB): A clear sign of a possible internal shift after the impulsive rally.
Liquidity Sweep: Price wicked into resistance before pulling back — a classic trap for late buyers.
Expected Play: Look for a possible lower high formation, then continuation towards the target at $3.17.
📉 Trade Idea: A short opportunity can be considered if price fails to reclaim above $3.80 and shows further bearish price action or supply zone rejection confirmation.
CHainLink | Trade-Setup📌 After the breakout from the last high at $18, a bullish sequence (orange) has now been activated.
📊 These setups typically occur no more than twice per year on any given altcoin, so I’ll be aggressively buying each level at the B-C retracement area.
Trademanagement:
- I'm placing long orders at each level. ((If the price continues climbing, I’ll adjust the trend reversal level (green) accordingly and update my limit orders.)
- Once the trade reaches a 2 R/R, I’ll move the stop-loss to break-even.
- From a 3 R/R onward, I’ll start locking in profits.
✅ I welcome every correction from here on —
but I won’t enter any new positions at these top levels.
Stay safe & lets make money
PEPEUSDT broken trendline and bullish market aheadAs we can see on the major resistances which was red trendline broke and price now after more range here or without it can see more gain at least to the targets like 0.000017$.
DISCLAIMER: ((trade based on your own decision))
<<press like👍 if you enjoy💚
Pepe's Bullish Bias Intensifies · 217% PP = 1085% 5X Lev.The bullish bias for PEPEUSDT is starting to intensify, still early of course. It is still early on this one because the action is still lower than the 19-May high. There are many projects that are already trading above their last high. So it is good news to find a pair that is moving below because we know that soon it will be moving above. In the coming days.
While the 19-May wick high reached 0.00001632, the weekly close happened at 0.00001361. As you can see from the chart, the current price is already higher than the highest weekly close and this gives us a strong bullish signal.
Notice again how the action moved above EMA89 back in mid-April. When the retrace happened, May-June, the recovery happened above this level. A signal of strength.
PEPEUSDT moved briefly below EMA55 only two recover and this is the second week above this level. Trading weekly above EMA55 & EMA89 means that the bullish bias is fully confirmed. A fully confirmed bullish bias means we are set to witness a higher high, and a higher high means prices moving above 0.00001953, short-term. In a matter of days.
The main target for this move is 0.00004264 giving us a nice 217%. With 5X leverage, relatively low risk, that would be beyond 11X (1,085%).
In a matter of days, the entire altcoins market will be bullish and moving higher. Make sure you are fully invested by the time everybody is rushing to buy. That is, you should be all-in now. It is not too late.
Thank you for reading and for your continued support, it is truly appreciated.
Namaste.
$DOGE Double Bottom TargetIf this double bottom "W" pattern on CRYPTOCAP:DOGE plays out, the target is $0.47.
Two notes:
1. The double-bottom pattern has a 60-65% success rate (no guarantees).
2. The Alt market has been very strong, with new dollars entering the market. If we close above $0.25-0.26 and retest, I think this target is likely as it returns to the high for this cycle.
Ready For Floki’s 30 Percent Surge? Main Target 0.00017Hello✌
Let’s analyze Floki’s upcoming price potential 📈.
BINANCE:FLOKIUSDT has confidently broken through its recent resistance levels 🚀, signaling strong upward momentum. Aiming for at least a 30% gain, the main target is set around 0.00017. Keep an eye on this level as it could offer a solid opportunity for those ready to ride the next wave 📈.
✨ Need a little love!
We pour love into every post your support keeps us inspired! 💛 Don’t be shy, we’d love to hear from you on comments. Big thanks , Mad Whale 🐋
TON/USDT : Get Ready for a new Rally! (READ THE CAPTION)By analyzing the Toncoin chart on the 3-day timeframe, we can see that the price has finally managed to grow over 3% as expected, and is currently consolidating above the $3 level. We’ll have to see how far this bullish momentum can continue — but to be honest, I expected a stronger move considering the market rally and Bitcoin repeatedly hitting new ATHs. Still, no worries — once Bitcoin takes a breather, altcoins will likely begin their powerful runs! Based on previous analysis, the next targets are $3.15, $3.63, $4.20, and $4.68 respectively.
Please support me with your likes and comments to motivate me to share more analysis with you and share your opinion about the possible trend of this chart with me !
Best Regards , Arman Shaban
$FLOKI | Dual Reversal Structure Detected SEED_DONKEYDAN_MARKET_CAP:FLOKI has executed a high-conviction breakout from a converging double bottom + inverse head & shoulders formation — both classic bullish reversal patterns.📊🔥
💥 Technical Breakdown:
• Double bottom with neckline break confirms demand zone absorption
• Breakout with retest and expanding volume = institutional-grade confirmation
• Target zones aligned with Fibonacci extensions and prior HVN zones
🎯 Fib Extension Targets:
→ 0.0001965 (0.618)
→ 0.0002375 (0.786)
→ 0.0002898 (full measured move)
📈 Structure + volume = conviction. This is how trend reversals are born.
LINKUSD - Possible Correction from Channel ResistanceStructure: Ascending Channel
Indicators: RSI Overbought, Bearish Divergence Forming
📌 Confirmation:
Look for:
A strong bearish candle or
RSI breaking below 60
Volume divergence
Bias: Short-term bearish correction, bullish structure intact as long as price holds the channel.
The Setup: Bullish Breaker in Play!Yesterday, BTC smashed into a strong bullish breaker and bounced like a champ. Today, it’s retracing back to this key level, setting up for what I expect to be another explosive buy reaction. Why? Because this breaker is rock-solid, and the price action is giving us all the right signals! Plus, it’s Friday—the last trading day of the week—and I’m betting BTC will stretch its legs to cover the weekly range. 🏃♂️
🎯 Trade Details: Where to Jump In
Buy Area: Right now, the price is teasing the breaker zone.
Stop Loss: Protect your capital with a stop loss at around ~117,700.
Target: We’re aiming for the Buyside Liquidity sitting pretty around 121,000. That’s a juicy move with solid risk-reward potential! 💪
🧠 Why This Trade Makes Sense
Bullish Breaker Strength: This level has proven itself as a springboard for price action.
Weekly Range Play: Fridays often see BTC push to cover its weekly range, and we’re in prime position to catch it.
Liquidity Grab: The Buyside Liquidity at 121,000 is like a magnet for price—let’s ride it there!
⚠️ Risk Management Reminder
Always trade smart! Use proper position sizing, stick to your risk management rules, and don’t go all-in like it’s a casino. Keep those stops tight to avoid getting wrecked by any sudden volatility. 😎
💬 Join the Conversation!
What do you think of this setup? Are you jumping on this BTC train or waiting for more confirmation? Drop your thoughts in the comments below! 👇 Also, if you like this idea, smash that LIKE button ❤️ and follow for more trade ideas to keep your portfolio poppin’! 🚀
Happy trading, and let’s stack those pips! 💰
#BTC #CryptoTrading #BuyTrade #Bullish #TradingView