• Products
  • Community
  • Markets
  • Brokers
  • More
Get started
  • Markets
  • /USA
  • /Stocks
  • /Ideas
Markets Converging MVIS market changing potentialMicrovision is weeks away from hitting an intense inflection point. Pending news for SBMC (decision date August 29th ) Microvision is partnered with NVDA for their driving lidar and software -- and have a plug and play system better than any competitor. (an update was made to MVIS website while not yet on the NVDA website. Possibly indicating pending news related) Industrial contracts are positioned to come in by September of this year. Potentially in the month of August/September MVIS could announce news of wins in 3 different verticals absolutely flipping the bear base upside down. causing an insane short squeeze. (to TRUE/FAIR market evaluations) 
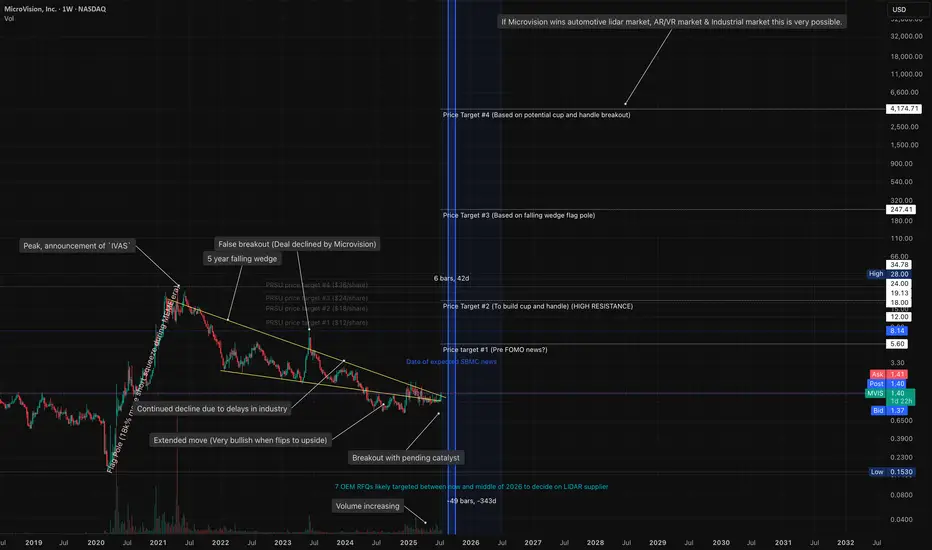
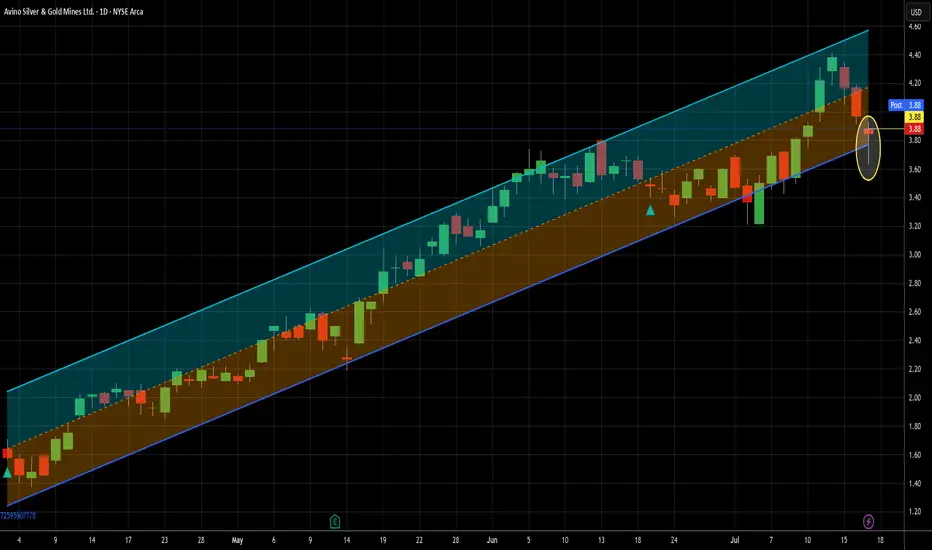
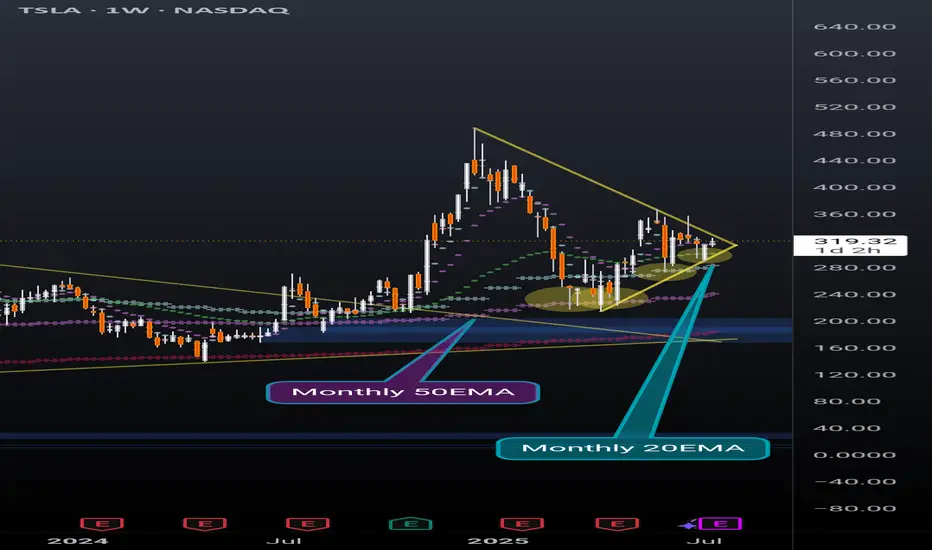
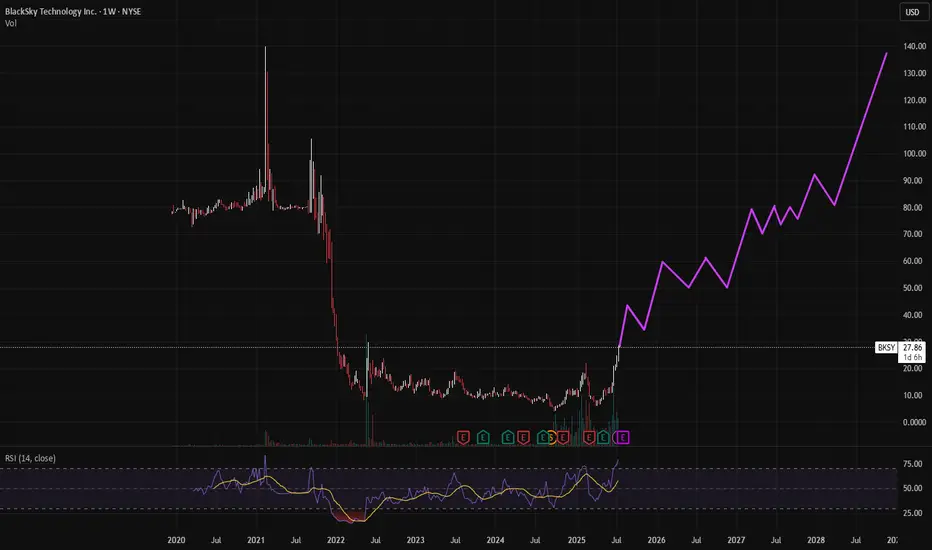
The 5 year chart I have shown indicate moves and price targets as well as time frames for news. The consolidating 5 year wedge can also be seen as wyckoff accumulation. There are multiple indicators implying bullish divergences on the 5 year time frame. People WANT MVIS. These markets MVIS are entering are HUGE and going to grow astronomically. The potential upside if MVIS is established as the key player could be INSANE. Lidar competitors have typically 1 vertical. Microvision has 5. I believe the catalyst to all of this is news related to SBMC. industrial and automotive OEMs are conservative and want a company that will survive to fulfill their needs. an SBMC would guarantee survivability and military approval. I believe multiple OEMs are waiting for this exact moment. if MVIS is selected by the DoD, then a domino effect will happen in all 3 markets. META, GOOGLE, APPL will also then see the AR tech validated & may proceed with trying to buy them out or purchase licenses. This stock, could be THE stock of a lifetime.
NASDAQ:MVISLong
by CommissionGlum
99
AAPL – Bullish Wedge Breakout Setup Toward Gap FillAAPL NASDAQ:AAPL has broken out of a descending trendline and is now consolidating inside a bullish wedge pattern . Price is holding above the 200 SMA and hovering near the 50 SMA. The structure suggests a potential breakout above the wedge, with a clear gap area between $216–$224 acting as the next upside target. Key levels: Support: $206 (wedge base / 50 SMA) Resistance: $216–$224 (gap zone) Trend structure: Bullish consolidation after breakout A clean breakout from the wedge with volume could trigger a continuation move toward the gap zone. 📌 Watching for confirmation and potential entry on a breakout + retest. This is not financial advice. Always do your own research.
NASDAQ:AAPLLong
by Binhuseyn
77
META Double Topping!Does it get any easier than this? NOPE! If you can't spot this pattern from 1000 miles away, then you need a lot more time in the seat, training yourself in TA. Simple with great risk reward! Bulls GTFO!
NASDAQ:METAShort
by RealMacro
55
QS Breakout Setting Up — Entries Triggered, Waiting for ConfirmSeed System entries are printing on QS with trailing profit zones holding firm. MACD crossovers confirming the move. Watching RSI cooling just under breakout resistance at $11.35. A push through $11.50 with volume and I’m adding — slowly. Support at $10.03, cut fast if price shows weakness. Let the market do the heavy lifting. #QS #SeedSystem #SwingTrading #TrendFollowing #LivermoreStyle #BreakoutWatch
NYSE:QSLong
by seed
11
New Setup: DAVEDAVE has gotten oversold with a potential bullish divergence on my RSI-5. If DAVE can manage to close higher than the previous candle's high, then we can look for a bounce providing the rest of the Market is bouncing also.
NASDAQ:DAVE
06:05
by StockHunter88
22
I'm just going to keep putting the hammer down - Long at 3.88I've done two other ideas for ASM in the last 3-1/2 months, so I'm not gonna rehash all those details here. If you are new to me or to my ideas for this ticker, just look at those. In them, I make a fairly compelling argument for short term trading this name. I'll sum it up quickly here - it's been extremely profitable. I'm expecting no different this time. Since my last idea on June 20th, there has been only one buy signal on this name until this week, but that one paid 9.5% in two trading days. Today's signal is actually the 3rd in a row (not uncommon for this ticker) and full disclosure, I traded the other two so I'm in this already. That said, today's signal is extra spicy, thanks to that pretty little hammer of a candlestick that printed today. For those unfamiliar, it is often a sign of a bullish reversal. It requires confirmation, but given the perfect record my signals have provided to this point on ASM, I can justify not waiting for that confirmation as it can cause missed trades if the stock jumps 4 or 5% the next day, as it is fond of doing. But if someone were to jump in on this trade but wanted to wait for confirmation, I believe that the move here would last more than one day, should it happen. I also have been increasing my exposure to inflation-related trades lately and why not get that from something that bumps like this does? The solid uptrend that goes back well farther than this chart shows sweetens the deal even more. Given that my first recent signal clicked at the 4.17 level two days ago, I'm expecting a move to and beyond that level in the relatively near term, though that's obviously not a guarantee. I will likely get out of this leg of the trade before it gets there, unless it does it in one move, which isn't out of the question at all. That's only about 7.5% above the current price and this stock moves that much in a day semi-frequently. Twice in the last 7 trading days, in fact. So that's my case. If the market stays semi-strong, this will likely stay weak until the market cools off some. This is my second add to my real life position, so I'm certainly not shy about adding more if my signals warrant it. As always - this is intended as "edutainment" and my perspective on what I am or would be doing, not a recommendation for you to buy or sell. Act accordingly and invest at your own risk. DYOR and only make investments that make good financial sense for you in your current situation.
AMEX:ASMLong
by redwingcoach
11
Palantir Is Up 600%+ Since August. What Do Its Charts Say?National-security software firm Palantir Technologies NASDAQ:PLTR hit a new all-time high this week and has gained more than 600% since hitting a 52-week low last August. What does technical and fundamental analysis say could happen next? Let's look: Palantir's Fundamental Analysis PLTR has been on a tear of late, hitting a $153.91 intraday record high on Thursday. (Full disclosure: I own the stock.) Shares have been rising in part because NATO member nations recently agreed to increase defense and defense-related infrastructure spending to 5% of each country's gross domestic product -- news that could play right into the company's hands. Only Spain opted out from among the 32 Western nations that belong to the military alliance, although Canada went along only somewhat reluctantly. The move surprised many NATO observers. Just some eight years ago, President Trump couldn't get a majority of these nations during his first term to pay what he called their "fair share" -- which was then mandated at only 2% of GDP. But having a hostile Russian Army in Ukraine knocking at NATO's front door has changed global perceptions of what's fiscally necessary and what's not. Spain and Canada are far away from the Russia-Ukraine war, but some NATO members physically closer to the fighting have far more enthusiastically embraced the new 5% spending target. What becomes of these promises to boost military spending? There will, no doubt, still be costly purchases of expensive military hardware like tanks, artillery, aircraft and naval vessels. But intelligence provided by the kind of data-based, AI-assisted analysis that Palantir sells seems likely to only grow in significance. Purchasing such intelligence (or the high-tech, modern systems to gather it) looks to be far more cost-effective than simply throwing money at things like submarines and fighter aircraft. That's what nations need these days for national security, as well as what many large businesses need just to compete. All of that sounds like music to Palantir's ears. The company will report Q2 earnings after the closing bell on Aug. 4, with analysts looking for the firm to post $0.14 in adjusted earnings per share on $939.3 million of revenue. That would represent a 55.6% increase from the $0.09 in adjusted EPS and 38.5% improvement on the $678.1 million in revenues that PLTR reported for the same period last year. Of the 19 sell-side analysts I found that cover Palantir, 12 have revised their earnings estimates higher since the current quarter began, while three have lowered their forecasts. Palantir's Technical Analysis Now let's take a look at PLTR's charts, beginning with this one that runs from January through Tuesday afternoon: Readers will first note that Palantir continues to break out from the bullish "cup-with-handle" pattern that became visible this spring (shaded purple in the chart above). The stock's Relative Strength Index (the gray line at the chart's top) also remains quite robust, but is not yet technically overbought. Similarly, Palantir's daily Moving Average Convergence Divergence indicator (or "MACD," marked with gold and black lines and blue bars at the chart's bottom) is postured bullishly as well. Within that MACD, the histogram of the stock's 9-day Exponential Moving Average (or "EMA," denoted with blue bars) is above zero. That's often seen technically as short-term bullish. Meanwhile, Palantir's 12-day EMA (the black line) is back above its 26-day EMA (the gold line), with both in positive territory. That's also a historically bullish signal. Now let's look at PLTR's chart going back 12 months: Taking a longer look back, we can take a Raff Regression model (the orange and purple field above) and place it over the stock's price action to better illustrate the trend that's in place. This view shows PLTR riding its 21-day EMA (the green line above) since mid-April. Palantir's current pivot is the upper trendline of the model -- about $156 in the chart above vs. the $153.43 that PLTR was trading at on Thursday afternoon. The stock's 50-day SMA (the blue line at $131.40 in the chart above) represents PLTR's downside pivot, with the Raff Regression model's lower trendline not too far below that for potential support. (Moomoo Technologies Inc. Markets Commentator Stephen “Sarge” Guilfoyle was long PLTR at the time of writing this column.) This article discusses technical analysis, other approaches, including fundamental analysis, may offer very different views. The examples provided are for illustrative purposes only and are not intended to be reflective of the results you can expect to achieve. Specific security charts used are for illustrative purposes only and are not a recommendation, offer to sell, or a solicitation of an offer to buy any security. Past investment performance does not indicate or guarantee future success. Returns will vary, and all investments carry risks, including loss of principal. This content is also not a research report and is not intended to serve as the basis for any investment decision. The information contained in this article does not purport to be a complete description of the securities, markets, or developments referred to in this material. Moomoo and its affiliates make no representation or warranty as to the article's adequacy, completeness, accuracy or timeliness for any particular purpose of the above content. Furthermore, there is no guarantee that any statements, estimates, price targets, opinions or forecasts provided herein will prove to be correct. Moomoo is a financial information and trading app offered by Moomoo Technologies Inc. In the U.S., investment products and services on Moomoo are offered by Moomoo Financial Inc., Member FINRA/SIPC. TradingView is an independent third party not affiliated with Moomoo Financial Inc., Moomoo Technologies Inc., or its affiliates. Moomoo Financial Inc. and its affiliates do not endorse, represent or warrant the completeness and accuracy of the data and information available on the TradingView platform and are not responsible for any services provided by the third-party platform.
NASDAQ:PLTR
by moomoo
22
Long entry TSLA - Weekly Time FrameIt seems price failed to make a lower low that reversed the most "immediate" uptrend. Therefore, trying to play the entry against those who went short. Lets see how it plays ouy
NASDAQ:TSLALong
by canjpo
11
FHNthe last financial news came out good and this means that the fundamentals are good, the technicals are also good. must buy
NYSE:FHNLong
by nortoy2105
33
Double Top in MELI – Potential Reversal Inside a Channel🧠 Double Top in MELI – Potential Reversal Inside a Channel Ticker : MercadoLibre, Inc. (MELI) Timeframe : 1D (Daily Chart) Pattern : Double Top Bias : Bearish Reversal within a Bullish Channel Technical Breakdown We're spotting a clean Double Top at the upper boundary of a long-term ascending channel , a key zone where price has struggled multiple times in the past. Here’s what stands out: Two clear peaks around $2,700, signaling buyer exhaustion. Price has now broken the minor support (neckline) around $2,350, which could trigger further downside in the short term. The pattern is forming inside a well-defined upward channel, so this move could just be a healthy pullback within the larger trend, or the beginning of something deeper... 📐 Trade Setup Entry : After the neckline break (~$2,350) Stop Loss : Above recent highs, at 5% risk Take Profit : Projected to 6.5% lower, toward the midline of the ascending channel and a high-volume node on the VPVR 📊 The Volume Profile (VPVR) supports this setup: Lower liquidity between current price and the $2,200–2,250 zone may accelerate the move. High-volume support is found at the TP zone, which makes it a smart target. 📘 Educational Insight This setup is a great example of how classic chart patterns (like the Double Top) can still be relevant, even within strong uptrends. A key lesson here: Not every reversal is a trend change. Sometimes, it’s just a rotation to rebalance price within structure (like this channel). Risk management becomes crucial. 💬 What do you think? Is MELI heading for a deeper pullback or just catching its breath? Hit the 🚀 if this helped clarify the setup, and follow for more clean, educational ideas!
NASDAQ:MELIShort
by TopChartPatterns
11
NVDA SELLSELL NVDA at 149.00 to 163.00, riding it back down to 93.00 to 77.00 as Profit Targets, Stop Loss is at 172.00! If anyone likes long mumbo jumbo garbage analysis, than this is NOT for you. Also, if you are afraid of risk, failure, and want only a 100% sure thing, than run as fast as you can from the markets, because the markets are NOT a sure thing, so it is definitely NOT for you. WARNING: This is just my opinions of the market and its only for journaling purpose. This information and any publication here are NOT meant to be, and do NOT constitute, financial, investment, trading, or other types of advice or recommendations. Trading any market instrument is a RISKY business, so do your own due diligence, and trade at your own risk. You can loose all of your money and much more.
NASDAQ:NVDAShort
by pstock123
Updated
33
NBIS 55 BREAKOUT in the works!NBIS is an AI darling and a big momentum stock. When it goes it goes! it has been testing this 55 level for some time now. We recently had a big GS upgrade that "woke" it up. A rest day here and another one will let the 9ema catch up to it and allow for a big breakout. If we take out this trendline at 55 ill put the stop 9ema and swing this.
NASDAQ:NBISLong
by kunal00
11
TSLA weekly coiling into something powerfulNever doubt the power of TSLA. Recently broke out of a huge pennant, and now nearing the end of another pennant while simultaneously holding support above the daily 20EMA(overlayed on this weekly chart). Also recently found support off of the monthly 20EMA (overlayed on this weekly chart) and took 2 direct hits on the monthly 50EMA (overlayed on this weekly chart) before that and rallied up. It will take a lot to crush this setup but anything can happen. Possibly a longer pennant formation. I'm just a cat not a financial advisor.
NASDAQ:TSLALong
by BorrowedClothes
22
MSTR NASDAQ:MSTR looks like it’s gearing up for a pullback — eyes on the $395 level for a potential retest. Watch the support. 👀📉 #MSTR #Bitcoin #Stocks #Tech #Trading
NASDAQ:MSTRShort
by alyt
Updated
33
$RKLB Overvalued asf! - NASDAQ:RKLB is overvalued. I will either stay on the sidelines or short the heck out of this POS. - Company sells hopium which doesn't have meaningful materialization as of now and not even in the distant future. Fundamentally, 2025 | 2026 | 2027 | 2028 -0.32 | -0.08 | 0.17 | 0.47 Revenue: 576.83M | 905.01M | 1.21B | 1.69B - Market cap of NASDAQ:RKLB currently sits at 24.61B as of July 17, 2025. - People who are buying now are buying someone else bag and are in for a horrible ride. - Consider buying it under $15 if you are super bullish
NASDAQ:RKLBShort
by bigbull037
11
Short - AMDTime period for this play : week to months Analysis : Elliot wave 12345 ABC. Expect hitting .618 and bounce back up to go higher. Pattern if wave B completed : Head & Shoulder Price Target: Wave ABC ETA Timeline for correction. Please refer to the chart. Upcoming events: Tariff active on 8/1/25 - Friday Earning on 8/5/25 - Tuesday Top is not in yet, so 2 Possible top-in levels: Top 1 - $163.45 : Retesting to hit 163.45, rejected, and break $158 Top 2 - $173.94 : Breaking 163.45 and reject at 173.94 => Overall, It begins trading side way and show some weakness now. The correction may not pull back to .618, which is the best level. Other scenarios: - 0.5 fib, where it test wave 3 - 0.328 fib, strong bullish level if it doesn't break & go to the upside faster
NASDAQ:AMDShort
by Contradnging
44
COIN -- Major Trendlines + Bearish Divergence = Breakdown?Hello Traders! Today I have shared the chart of COINBASE. Of course we cant know for sure what price will do, however you can take clues and combine them to give you a high probability reading of the chart. Here are the clues: 1) MAJOR TRENDLINE 2) TRENDLINE 3) BEARISH DIVERGENCE 4) BULL FLAG MEASURED MOVE When we combine these clues, a very bearish picture is painted... This signals to me that there is a high probability price will likely reverse and trade to the downside in the near future. I hope everyone enjoyed this post and is able to use it as an educational tool. Thanks everyone and best of luck on your trading journey!
NASDAQ:COINShort
by natef1
22
PG Approaching Oversold Discount Zone Ahead of Q4 Earnings BTFD?📝 Procter & Gamble (NYSE: PG) is trading at $153.73 (-10.8% YTD), lagging the S&P 500’s +6.5% YTD gain. Despite recent weakness, a confluence of technical support, dividend resilience, and a looming catalyst could signal a tactical entry. Let’s break it down: 🔍 Fundamentals & Catalysts Q4 Earnings Webcast (July 29): P&G will webcast Q4 results at 8:30 AM ET, with focus on organic sales growth (guided at +2% FY25) and margin trajectory 14. EPS Expectations: Q4 consensus at $1.43 (+2.1% YoY); FY25 core EPS guided at $6.72–6.82 (2–4% growth) 410. Dividend Fortress: Quarterly payout raised to $1.0568/share (ex-div: July 18), marking 69 consecutive years of increases and a 2.75% yield 612. Payout ratio at 67% of earnings – sustainable for a consumer staple 6. Cost Pressures & Mitigation: Tariff Headwinds: $1B–$1.5B annual cost hit from U.S.-China tariffs 410. Offsets: $2.4B dividend payouts + $1.4B buybacks in Q3; 280bps gross productivity savings 10. 🌍 Macro & Risk Factors Consumer Softness: Q3 net sales fell -2% YoY; volume declines in Baby Care (-2%) and Fabric & Home Care (-1%) segments 10. Pricing Power: Average +1% pricing in Q3 (led by Grooming/Health Care), though mix/elasticity risks persist 104. Structural Shifts: Portfolio pruning (minor brand exits) and job cuts to offset tariff impacts 4. 📉 Technical Setup: Oversold with Base-Building Potential RSI 31.5 (Neutral but nearing oversold) 511. Price vs. MAs: Below all key MAs (20-day: $159.17, 50-day: $161.59, 200-day: $165.56) – signaling bearish momentum but extreme discounts 5811. Support Zone: $152–153 aligns with 52-week lows ($151.90) and the 2025 dividend-capture floor 212. MACD -1.57: Suggests potential reversal if momentum shifts 5. Technical Indicators Summary: Indicator Value Signal RSI (14) 31.45 Neutral MACD (12,26) -1.57 Buy Price vs. 200D SMA -7.1% Sell Bollinger Bands (25) $157–161.94 Sell 🎯 Probabilistic Price Targets Scenario Target Probability Rationale Bounce to 20D MA $158–160 60% Mean reversion + dividend ex-date support Reversion to 50D MA $162–164 45% Technical confluence + tariff resolution hopes Rally to 200D MA + ATH $174 25% Bull case: Macro stabilization + guidance upgrade 📌 Trade Strategy Entry: $152–154 (aligns with structural support) 28. Stop Loss: $149.50 (1–2% below July 16 low of $152.27) 2. Targets: Scale out at $160 → $164 → $174. Catalysts: Q4 earnings (July 29) + clarity on tariff mitigation 14. Position Size: Allocate 3–5% of portfolio; pair with long-volatility hedge. ⚠️ Key Risks Guidance Miss: Sluggish volumes or tariff escalation could pressure FY26 EPS projections. Technical Breakdown: Close below $151.90 invalidates support, inviting a slide to $145. Macro Sensitivity: Consumer staples underperformance if inflation rebounds. 💎 Final Take PG offers a rare combo: defensive yield (2.75%) + oversold technicals + imminent catalyst. While tariffs and consumer weakness justify caution, the $152–154 zone is a high-probability dip-buying opportunity. Earnings day vol could amplify moves – enter pre-event with tight stops. #PG #ConsumerStaples #DividendKing #EarningsPlay #Tariffs Disclaimer: This is not financial advice. Conduct your own due diligence.
NYSE:PGLong
by Wavervanir_International_LLC
11
BKSY LONGHere is my analysis of this uptrend. A little on the hopium side but I think we should revert to the IPO price soon before take off!
NYSE:BKSYLong
by PepeJr
22
Continuation with exact bull flag for back to back %15 on ITMSF Price discovery is occurring and much more to go to get to $5.... :)
OTC:ITMSFLong
by BrandonOsborne
11
I'm scared of this stock and I'm buyingWall St. has already written the obituary on NASDAQ:SRPT —but that’s exactly why I’m stepping in. Back in 2020 (link below) I traded a setup from a Spike at 50% Retracement up to its prior ATH near $170, cashed out, dodged the drug-trial IV grenade. I saw 50% of market cap evaporate in a gap. Scared me, made me even more appreciative of risk. This year alone? Three separate -27% to -50% drawdowns. Yikes is right… and capitulation smells like opportunity. Risk management: I’m sizing the trade as if it can drop another -50%. If I’m wrong, pain is survivable. If the market over-shot, upside is asymmetric. Whoever’s left is either hedged or numb—perfect soil for a rebound. Process: 🗑️ Find the trash → Measure the multi-year Volume Profile → Size for worst case → Buy when everyone tells you it's wrong → Hold for return to form
NASDAQ:SRPTLong
by norok
33
Unusual Volume Surge in $SBET — What’s Going On?NASDAQ:SBET is up 24.11% today, but the accumulation pattern seems... off. Volume looks suspiciously inflated. Is this just a short-term squeeze or is there something deeper brewing behind the scenes? Anyone familiar with the fundamentals or insider activity on this name? Drop insights below — curious to see what others are picking up on. Let me know if you want: A more technical tone (with indicators like OBV or Acc/Dist) A follow-up chart analysis
NASDAQ:SBETLong
by Wavervanir_International_LLC
44
NVDA - Going VerticalNVDA has continue to see our near vertical trajectory to the upside. After yesterday's test of our blue trendline on the daily at $160 price bounced and has now moved up to $170. Due to the angle of this trend we will break to the downside very soon, but most likely not before some sort of blow off top move towards the $200 level. It is possible we continue to go vertical but just below $200 seems to be where the major level is to see some take profit start occurring. Also market structure has been super strong which you can see by the retest and hold of the $153 level (yellow dotted line). This was the previous ATH that NVDA recently created as a new level of support with that retest.
NASDAQ:NVDA
by VIAQUANT
11
112233445566778899101011111212131314141515161617171818191920202121222223232424252526262727282829293030313132323333343435353636373738383939404041414242
…999999

Select market data provided by ICE Data services. Select reference data provided by FactSet. Copyright © 2025 FactSet Research Systems Inc.© 2025 TradingView, Inc.

More than a product
  • Supercharts
Screeners
  • Stocks
  • ETFs
  • Bonds
  • Crypto coins
  • CEX pairs
  • DEX pairs
  • Pine
Heatmaps
  • Stocks
  • ETFs
  • Crypto
Calendars
  • Economic
  • Earnings
  • Dividends
More products
  • Yield Curves
  • Options
  • News Flow
  • Pine Script®
Apps
  • Mobile
  • Desktop
Community
  • Social network
  • Wall of Love
  • Refer a friend
  • House Rules
  • Moderators
Ideas
  • Trading
  • Education
  • Editors' picks
Pine Script
  • Indicators & strategies
  • Wizards
  • Freelancers
Tools & subscriptions
  • Features
  • Pricing
  • Market data
Trading
  • Overview
  • Brokers
Special offers
  • CME Group futures
  • Eurex futures
  • US stocks bundle
About company
  • Who we are
  • Manifesto
  • Athletes
  • Blog
  • Careers
  • Media kit
Merch
  • TradingView store
  • Tarot cards for traders
  • The C63 TradeTime
Policies & security
  • Terms of Use
  • Disclaimer
  • Privacy Policy
  • Cookies Policy
  • Accessibility Statement
  • Security tips
  • Bug Bounty program
  • Status page
Business solutions
  • Widgets
  • Charting libraries
  • Lightweight Charts™
  • Advanced Charts
  • Trading Platform
Growth opportunities
  • Advertising
  • Brokerage integration
  • Partner program
  • Education program
Community
  • Social network
  • Wall of Love
  • Refer a friend
  • House Rules
  • Moderators
Ideas
  • Trading
  • Education
  • Editors' picks
Pine Script
  • Indicators & strategies
  • Wizards
  • Freelancers
Business solutions
  • Widgets
  • Charting libraries
  • Lightweight Charts™
  • Advanced Charts
  • Trading Platform
Growth opportunities
  • Advertising
  • Brokerage integration
  • Partner program
  • Education program
Look FirstLook First