• Products
  • Community
  • Markets
  • Brokers
  • More
Get started
  • Markets
  • /USA
  • /Stocks
  • /Ideas
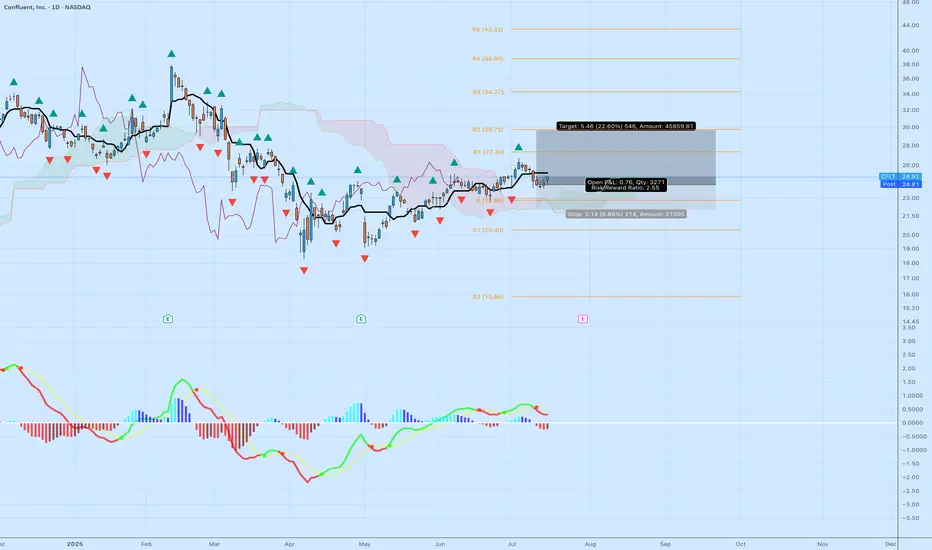
CFLT: Bullish Momentum Breakout Targeting $29.76 – Strong R/R Ticker: NASDAQ:CFLT (Confluent, Inc.) Bias: Long Timeframe: Daily (with momentum building from May lows) Entry: Around $24.30 (near recent breakout above pivot at $22.80) Stop Loss: $22.14 (below swing lows, ~8.86% risk) Target: $29.76 (near R2 resistance, ~22.60% reward) Risk/Reward Ratio: 2.35:1 Position Sizing Suggestion: Limit risk to 1-2% of capital (e.g., ~$21,000 total risk on 3,271 shares as shown) Confluent (CFLT) is showing strong bullish momentum on the daily chart, breaking out from a multi-month consolidation base between $18–$23 since April 2025 lows. The price has formed higher highs and lows, supported by a bullish MACD crossover (green signal line above red, positive histogram bars), indicating accelerating upside potential. RSI is neutral around 54–60, leaving room to run without being overbought. Volume has ticked up on recent green candles, confirming buyer interest. From a smart money perspective, institutional ownership stands at ~78%, with net buying in Q2 2025 (e.g., hedge funds adding ~7.1M shares). This aligns with Confluent's growth in real-time data streaming for AI and cloud applications, boosted by the July 2025 AWS Marketplace expansion for AI agents. Fundamentals support this: Q1 2025 beat expectations (EPS $0.08 vs. $0.07, revenue +26% YoY, Cloud segment +42%), though guidance was conservative amid macro IT spending slowdowns. Pivot points guide the trade: Break above P ($22.80) targets R1 ($27.33) then R2 ($29.73, close to my $29.76). If momentum holds (e.g., breakout above $25.82), we could see extension to $31–$32 based on analyst averages (Moderate Buy consensus, target ~$31.50 from 30 analysts). Risks to Watch: Upcoming Q2 earnings on July 30 could introduce volatility—consider trailing stops or exiting beforehand if holding through. Competition from hyperscalers (AWS, GCP) and broader tech sector dips (CFLT beta 1.71) could pressure if support fails. Not financial advice; always DYOR. If you agree with this setup or have thoughts on CFLT, drop a comment below! Hit like if this helps, and follow for more ideas. Let's see how this plays out—I'll update as needed. 🚀
NASDAQ:CFLTLong
by tothemoon_888
BTC TREASURY Adam Back, a satoshi era OG, is launching Bitcoin Standard Treasury Company (BSTR), which plans to go public through a merger with Cantor Equity Partners I (CEPO), a special-purpose acquisition company. BSTR will debut with 30,021 BTC, valued at approximately $3.5 billion, making it the fourth-largest public Bitcoin treasury. The company has secured $1.5 billion in private investment in public equity (PIPE) financing, the largest for a Bitcoin treasury SPAC merger, with CEPO contributing up to $200 million, subject to shareholder redemptions. The merger, expected to close in Q4 2025, aims to maximize Bitcoin ownership per share and accelerate adoption through Bitcoin-native financial products and advisory services. Ill be loading shares tommorrow and continuing to dca. Btc price swings will influence this heavily wind direction is currently North!
NASDAQ:CEPOLong
by WSMS199
COIN (Update) -- Potential Max Price TargetHello Traders! Coin seems to potentially have a little bit more steam left. If it does make one more push... where will price go? At $429.54 we have the All Time High for COIN.. interesting enough that price was hit on the first day of trading for COIN which adds to the significance of this price level. There is also a trendline connected from pivot to pivot. These two factors converge and create a significant level of resistance. Most likely I will be entering a short position at this level. Thanks everyone and best of luck on your trading journey!
NASDAQ:COINShort
by natef1
DDOG 15m – Discount Reversal Targeting $151.89 | VolanX Protocol📈 Datadog (DDOG) has completed a clean bullish structural shift off a deep discount zone, rejecting institutional demand around the $137–139 range. Now breaking above key internal CHoCH and BOS levels, price is accelerating into equilibrium, suggesting momentum is building toward premium inefficiencies. 🔍 Technical Breakdown: Massive previous BOS on July 3rd led to an overextended move that’s now correcting. Strong reclaim above $141 (ORB high and demand imbalance). Price swept strong low and confirmed bullish intent via nested CHoCH → BOS → continuation. Heading into low-resistance volume node up to $146 equilibrium, then targeting $151.89 premium supply. 📌 Critical Zones: Demand (Support): $139.75 → $137.00 → $136.00 (discount + strong low zone) Equilibrium Zone: $145.80–146.40 (short-term reaction likely) Target Liquidity Zone: $151.89 (Premium + prior weak high) 📊 VolanX Protocol Read: This setup aligns with a VolanX Reversal Protocol. The SMC framework suggests a fully developed market structure cycle (markdown → accumulation → markup). Price action is supported by consistent BOS levels and bullish reaccumulation signs. 🧠 Probabilistic Price Model: 70% → $145.8–146 (reaction near EQ + mitigation) 45% → $151.89 full premium sweep 15% → Breakdown below $139.75 invalidates bullish thesis ⚠️ VolanX Standard Disclosure: This post is for strategic modeling and educational purposes only. It reflects WaverVanir's internal DSS logic, not financial advice. Always backtest and confirm your execution model.
NASDAQ:DDOGLong
by Wavervanir_International_LLC
ALAB: High-Quality Breakout With Strong Structure and 3.2 R/RAstera Labs ( NASDAQ:ALAB ) just delivered a clean technical breakout above multi-week resistance, paired with bullish confirmation from momentum and Ichimoku structure. This isn’t a hype trade — this is what a textbook continuation breakout looks like. 📊 Key Technical Breakdown Base Breakout After weeks of tight consolidation, NASDAQ:ALAB just broke above horizontal resistance at ~$95. The breakout candle is strong, with above-average range and a decisive close. Ichimoku Cloud Price is well above the cloud — this confirms bullish trend. The Kijun (black line) is sloping upward, and the cloud is thick and rising. Pullbacks toward $88–90 could act as support if the breakout retests. MACD Reversal The MACD has flipped green, signaling a momentum shift. Histogram is expanding upward again, showing renewed buying pressure. This is happening as price reclaims the top of the recent range — a great alignment. 🎯 Trade Specs Entry: $97.02 Target: $133.25 (+37.34%) Stop: $85.32 (–11.51%) Risk/Reward: 3.24 — solid skew for a growth name Context: Strong prior trend, healthy consolidation, and now continuation. This isn’t a bottom-pick — it’s trend-following at a breakout moment. 🧠 Why This Trade Works Structure: You’re not chasing green candles. This breakout comes after a long base and clears prior congestion. Asymmetry: A 3.2+ R/R setup means you can be wrong more than half the time and still come out ahead — if you stick to your stops. Momentum Alignment: Momentum and price are moving together — never fade a breakout with confirmation from both price action and indicators. 📌 Tip for Readers: If you’re new to swing trading, study how this base formed and what conditions led to the breakout. The goal isn’t prediction — it’s positioning at the right moments with risk defined.
NASDAQ:ALABLong
by tothemoon_888
Updated
NIO smashing overhead resistanceWill start position with weekly close above 4.35. Initial stop below 3.75 as choppiness expected
NYSE:NIOLong
by robhood2
Picked Up More OKTATraders, We’re nailing it in the stock division. Our portfolio has gained nearly 30% since the inception of our new indicator in Sept. of last year. And we’ve done that with 50% of our cash on the sidelines nearly the entire time, further reducing risk. It is amazing how I stumbled upon this new trade strategy purely by accident. Not by following anyone else on Youtube or TradingView or X. But simply by doing what I love to do and spotting trends and patterns. The combo of the indicators I have been utilizing is truly working, outbesting SPY hodl’ers by 3-to-1 since implementation. At times, my indicator gives us more than one signal. This usually indicates that the move up will be stronger and more aggressive than previously indicated. Such is the case with our OKTA entry. We’ve got another BUY signal that has been given, and so, I am DCA’ing in. The target and SL will remain the same as our previous entry. All data can be found on the tracker. Best, Stew
NASDAQ:OKTALong
by stewdamus
ROK eyes on $245: Key Resistance break may Mark bottomROK trying to recover along with the general market. Now testing a well proven resistance at $243.94-245.03 Look for a Break-and-Retest for possible long term entry.
NYSE:ROK
by EuroMotif
Updated
Pepsi can retrace to 155 in short termVery short post: Pepsi NASDAQ:PEPS had a very good earnings call and based on fb retracement, this will retrace to 155 soon. It has potential to go abive that if the reversal is confirmed.
NASDAQ:PEPLong
by jamissonbond
MRK - Retesting BreakoutAfter being in a downtrend for almost a year things finally look like they are starting to turn around for MRK. Recently price broke the downwards sloping resistance and has retested that level as a new support level. We have also seen strength increasing on our daily RSI bringing some life back into this stock. Our first price target to the upside would be out LTF target around $88 followed by our 0.618 target around $111. If we see some serious strength and price climb above our previous ATH we could even see a move towards the $172 level.
NYSE:MRK
by VIAQUANT
UEC Box Breakout Confirmed – Riding VWMA on VolumeUEC broke out of the $6.80–$7.45 box with volume and is holding strong. VWMA rising, MACD trending, and RSI strategy taking partials. Watching $8.00 for target, $7.20 as trailing stop zone. Classic Seed System box breakout — low risk, clean structure. #UEC #SeedSystem #BreakoutTrade #VolumeConfirmation #UraniumStocks
AMEX:UECLong
by seed
22
BULL Webull price action has been very nice the past day. My people are DCAing into webull as we look at similar launch patterns to robinhood. With crypto bills passed. Yorkville acquiring a deal and partnership with webull. And stocks market increasing in interest. I can see this being a very nice gain to 50$
NASDAQ:BULLLong
by bag_dad
(Learn More)Use These 3 Steps To Spot Long-Lasting Trends👉Trade before the earnings report 👉Make sure the volume oscillator is below zero 👉Make sure the MACD lines give you a Bullish signal If you look at this chart you can see all the steps alignment. This is very important because you want to catch a long term trend. Also it has to follow the 3step rocket booster strategy. In order for you to learn more about this strategy 🚀 Rocket Boost This Content. Disclaimer ⚠️ Trading is risky please learn how to use Risk Management And Profit Taking Strategies. Also feel free to use a simulation trading account before you use real money.
NASDAQ:TSLALong
by lubosi
TSLA: Anyone knows this pattern?TSLA: Anyone knows this pattern? Think contrarily to the market — seek opportunities in things that few people notice or pay attention to, and when you do, opportunities will come to you earlier than they do to the crowd. . US STOCKS- WALL STREET DREAM- LET'S THE MARKET SPEAK!
NASDAQ:TSLALong
by usstockswallstreetdream
long for rdwlong NYSE:RDW This content is for informational and educational purposes only and does not constitute financial, investment, or trading advice. I am not a licensed financial advisor. Any opinions, analyses, or forecasts are my own and are subject to change without notice. Always do your own research and consult with a qualified financial advisor before making any investment decisions. Trading involves risk, and you should only trade with capital you can afford to lose. Past performance is not indicative of future results. ur welcome. H3VL1N
NYSE:RDWLong
by H3VL1N
RDDT - Ready for Round 2?RDDT is setting up a base here, let's see if it holds this previous support level around 80. Target 1 - 160 Target 2 - 180 Stop loss - 75
NYSE:RDDTLong
by just4tradin
Updated
22
Alibaba Group Wave Analysis – 17 July 2025 - Alibaba Group rising inside impulse wave (3) - Likely to reach resistance level 123.10 Alibaba Group recently rose with a sharp upward gap, breaking the resistance level 110.00 and the resistance trendline of the daily down channel from May. The breakout of these resistance levels accelerated the active intermediate impulse wave (3). Alibaba Group can be expected to rise to the next resistance level 123.10 (the former monthly high and top of wave B from June).
NYSE:BABALong
by FxProGlobal
Webull gonna catch up now...?NASDAQ:BULL has a rounding base and a cranked inverted head and shoulders on the4 hour this is a recent IPO looks ready to go
NASDAQ:BULLLong
by cookie_moon_star
HL-Insane Confluence HereChart speaks for itself. Confluence on many indicators suggests a hard bottom here
NYSE:HLLong
by Commodity_TA_Plus
3M - LTF Successful RetestWe have seen a liquidity zone form for the past year and finally we are looking at a successful retest. Given this holds as a new buying zone then our next target would be $170-$174 followed by the ATH around $216. If price fails to hold this liquidity zone as new support and price closes back below $154 then this would be a failed breakout.
NYSE:MMM
by VIAQUANT
BUY SETUP AOS#AOS 17.7.2025 ep - 69.49 sl - 65.59 (5.71%) tp - 75.90 (9.11%) rrr - 1.6X
NYSE:AOSLong
by Khairil_Anuar
Trump firing Jerome is bullish for $OPEN - Trump firing Jerome is bullish for physical assets like real estate, gold, materials. - Trump would most likely appoint a FED chair which will lead to lower interest rates. - Lower Interest rates (Macro tailwinds) + Improving business model (fundamentals) + technical breakout = 🚀
NASDAQ:OPENLong
by bigbull037
AAPL BULLISH WEDGEApple previously wedged, and broke out into the 213s. I previously tracked it but didn't enter. As of recent the volume has been thinning and the PA has been consolidating. I believe Apple has potential to breakout once again. The EMAs are also in more of a bullish stack. Hoping to hit somewhere in the 218-230. From a technical standpoint looks good but watch for general market sentiment and other tech stocks / QQQ as many have claimed they're due for a pullback and I agree. If they move Apple moves. Nfa
NASDAQ:AAPL
by machuv0
112233445566778899101011111212131314141515161617171818191920202121222223232424252526262727282829293030313132323333343435353636373738383939404041414242
…999999

Select market data provided by ICE Data services. Select reference data provided by FactSet. Copyright © 2025 FactSet Research Systems Inc.© 2025 TradingView, Inc.

More than a product
  • Supercharts
Screeners
  • Stocks
  • ETFs
  • Bonds
  • Crypto coins
  • CEX pairs
  • DEX pairs
  • Pine
Heatmaps
  • Stocks
  • ETFs
  • Crypto
Calendars
  • Economic
  • Earnings
  • Dividends
More products
  • Yield Curves
  • Options
  • News Flow
  • Pine Script®
Apps
  • Mobile
  • Desktop
Community
  • Social network
  • Wall of Love
  • Refer a friend
  • House Rules
  • Moderators
Ideas
  • Trading
  • Education
  • Editors' picks
Pine Script
  • Indicators & strategies
  • Wizards
  • Freelancers
Tools & subscriptions
  • Features
  • Pricing
  • Market data
Trading
  • Overview
  • Brokers
Special offers
  • CME Group futures
  • Eurex futures
  • US stocks bundle
About company
  • Who we are
  • Manifesto
  • Athletes
  • Blog
  • Careers
  • Media kit
Merch
  • TradingView store
  • Tarot cards for traders
  • The C63 TradeTime
Policies & security
  • Terms of Use
  • Disclaimer
  • Privacy Policy
  • Cookies Policy
  • Accessibility Statement
  • Security tips
  • Bug Bounty program
  • Status page
Business solutions
  • Widgets
  • Charting libraries
  • Lightweight Charts™
  • Advanced Charts
  • Trading Platform
Growth opportunities
  • Advertising
  • Brokerage integration
  • Partner program
  • Education program
Community
  • Social network
  • Wall of Love
  • Refer a friend
  • House Rules
  • Moderators
Ideas
  • Trading
  • Education
  • Editors' picks
Pine Script
  • Indicators & strategies
  • Wizards
  • Freelancers
Business solutions
  • Widgets
  • Charting libraries
  • Lightweight Charts™
  • Advanced Charts
  • Trading Platform
Growth opportunities
  • Advertising
  • Brokerage integration
  • Partner program
  • Education program
Look FirstLook First