Eli Lilly (LLY) – Full Technical + Fundamental Analysis (July 20
I wanted to take a deeper dive into LLY and analyze more than just trendlines—looking into both the technical structure and the broader fundamentals of the stock.
Sources: i have a list of sources at the end of my report
Technical Breakdown:
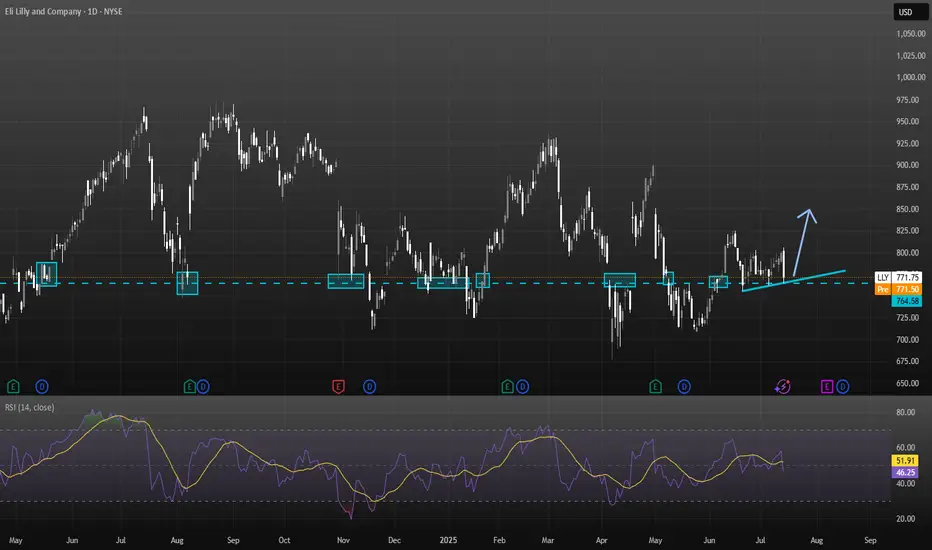
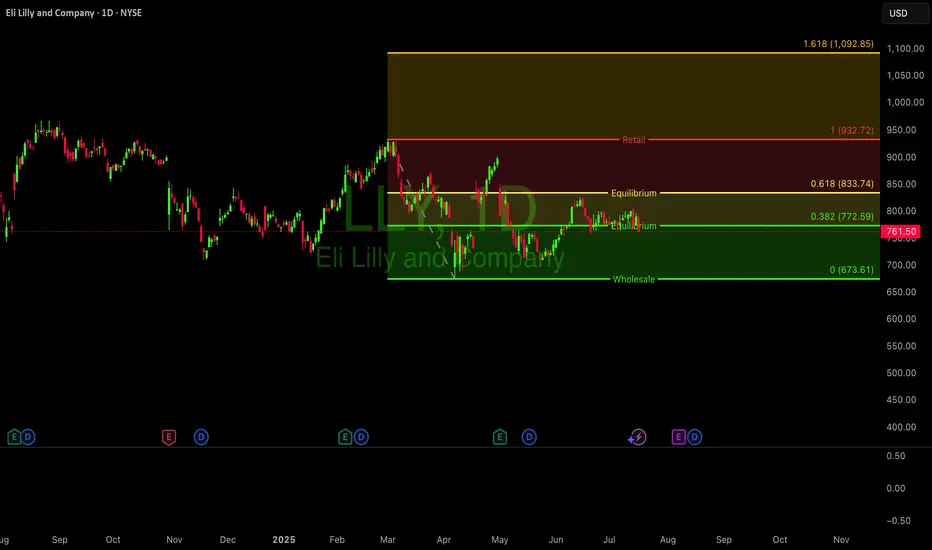
Current Price: ~$771.75
Resistance Zone: $950–970 prior rejection levels
Support Zone:
Strong: $760–765 (multiple historical rejections and rebounds).
Secondary: $717 (previous bounce area).
Trendline: Steadily rising higher-lows, supporting price above $760.
RSI: Recently cooled from 79 (overbought) to ~51 (neutral), suggesting balanced conditions. No immediate overbought or oversold signals.
Chart Pattern Summary:
Price respects a higher-low ascending trendline.
Buyers defend $760, but $800+ remains heavy resistance.
Breakdown below $760 risks a drop to ~$717.
Breakout above $800 opens upside toward $950–970.
Growth Catalysts:
1. Zepbound & Mounjaro dominate the obesity/diabetes sector.
2. Retatrutide & Orforglipron (next-gen obesity treatments) could further expand market share by 2026.
3. Revenue growth: ~45% YoY in Q4 2024.
4. Analysts forecast ~15% annual revenue growth and 20%+ EPS CAGR through 2027.
Risks:
1. Q1 2025 saw adjusted EPS guidance trimmed to ~$20.78–22.28 from previous ~$22.50–24, causing ~7% drop in stock .
2. Valuation rich: forward P/E ~35 vs peers like Novo at ~14
3. 025 EPS estimates have slightly fallen (from $22.20 to $21.94) while 2026 expectations rose.
4. New rival Hengrui/Kailera shows ~18–19% weight loss, close to Zepbound’s ~21%, though still pre-approval
5. Regulatory volatility: Trump has floated heavy pharma tariffs (up to 200%) and repatriation incentives; Lilly has U.S. capacity but details remain uncertain
Analyst Sentiment:
Consensus target: $1,000+ within 12–24 months.
MarketBeat & StockAnalysis rate LLY as Strong Buy.
Institutional ownership remains high.
What to Monitor Next
1. FDA approvals for orforglipron or retatrutide (expected late 2025).
2. Next earnings—watch for forward guidance recovery.
3. Policy shifts (potential tariffs on pharma imports).
4. Obesity drug competition (Novo Nordisk, Chinese biosimilars).
Final Position: Modest Long Bias
Eli Lilly is technically holding trendline support while fundamentally leading in a booming therapeutic sector. Together, this makes LLY a long-term buy, though caution near $760 is warranted.
I tried to summaries as short as possible as i didn't want to make this post into an essay
Please note this is not financial advice
Sources Used for Analysis:
1. Eli Lilly Company Filings & Reports
2. Latest Earnings Reports (Q1 2025, prior Q4 2024)
3. Pipeline Updates and FDA Submission News
4. MarketBeat (Analyst ratings & price targets)
5. Yahoo Finance (EPS estimates, revenue growth forecasts)
6. StockAnalysis.com (Valuation ratios, dividend data)
7. Bloomberg and CNBC (News on guidance revisions)
8. Federal Reserve statements and forecasts
9. Bureau of Labor Statistics (BLS) – healthcare inflation data
10. WSJ and Financial Times – reporting on pharma tariffs and global healthcare policy shifts
11. Industry and Sector Insights
12. Novo Nordisk Investor Updates – competitor tracking
13. Statista – Obesity/diabetes global prevalence reports
14. World Health Organization (WHO) reports
15. Standard RSI and trendline patterns (based on TradingView style)
16. Support/resistance zones derived from historical price action Market Sentiment Tools
17. CNN Fear & Greed Index
18. S&P 500 Health Care Sector ETF (XLV) trends
Best Buy’s Lower HighsBest Buy fell sharply on “Liberation Day.” Now, after a modest rebound, some traders may see further downside risk.
The first pattern on today’s chart is July 10’s peak of $74.75. That was below the June high, which in turn was under May’s high. Such a succession of lower highs could indicate a bearish trend.
The potential topping behavior is also happening below the close on April 2, immediately before President Trump announced aggressive tariffs.
Third, prices are stalling near the 50- and 100-day simple moving averages. That may reflect a bearish long-term trend.
Finally, the retailer has returned below its 8- and 21-day exponential moving averages. That may suggest short-term trends have gotten more bearish as well.
TradeStation has, for decades, advanced the trading industry, providing access to stocks, options and futures. If you're born to trade, we could be for you. See our Overview for more.
Past performance, whether actual or indicated by historical tests of strategies, is no guarantee of future performance or success. There is a possibility that you may sustain a loss equal to or greater than your entire investment regardless of which asset class you trade (equities, options or futures); therefore, you should not invest or risk money that you cannot afford to lose. Online trading is not suitable for all investors. View the document titled Characteristics and Risks of Standardized Options at www.TradeStation.com . Before trading any asset class, customers must read the relevant risk disclosure statements on www.TradeStation.com . System access and trade placement and execution may be delayed or fail due to market volatility and volume, quote delays, system and software errors, Internet traffic, outages and other factors.
Securities and futures trading is offered to self-directed customers by TradeStation Securities, Inc., a broker-dealer registered with the Securities and Exchange Commission and a futures commission merchant licensed with the Commodity Futures Trading Commission). TradeStation Securities is a member of the Financial Industry Regulatory Authority, the National Futures Association, and a number of exchanges.
TradeStation Securities, Inc. and TradeStation Technologies, Inc. are each wholly owned subsidiaries of TradeStation Group, Inc., both operating, and providing products and services, under the TradeStation brand and trademark. When applying for, or purchasing, accounts, subscriptions, products and services, it is important that you know which company you will be dealing with. Visit www.TradeStation.com for further important information explaining what this means.
AAPL Set for a Breakout? | Technical Checklist & Projections
▍Observation & Context
▪ AAPL has been moving sideways within a clearly defined range for the past three months .
▪ On July 07 , price tested the range resistance decisively, showing some interest in the upside.
→ Let's first explore the bullish breakout scenario.
▍What Makes a Good Breakout ?
Before we talk about targets, let’s define what a good breakout looks like:
▪ A strong bullish candle breaking through the resistance in one clean move .
▪ Followed by a retest of the broken resistance (now acting as support).
▪ After that, price should ideally:
1. Form a higher low , and
2. Reach the next resistance or target zone before pulling back.
▍Target Price – Method 1: Extension of the Range
🔹 Near-Term Target: 1.5–1.618x Fibonacci Extension
- A common zone where momentum often pauses.
- Aligns with the previous high from the last downtrend.
- Technically, to reverse a trend, price needs to take out the previous high. Even though the range has “cooled off” the pressure, we still respect that level.
🔹 Ultimate Target: 2x Range Extension
- Represents a 100% projection of the previous range.
- Commonly used in range breakout targets.
🔹 Dream Target: 2.618x Fibonacci Extension
- Aligns with the start of the last downtrend , adding significance to the level.
- Often marks the exhaustion point of strong trends.
▍Target Price – Method 2: Projection from Higher Low
Note: The new higher low is not yet confirmed at the time of writing. The levels below assume an upward breakout without dropping below 207.22 . However, the same logic can be applied once the higher low forms.
🔹 Near-Term Target: Same as Method 1
🔹 Ultimate Target: 100% Projection of Prior Swing
- Projecting the prior swing (from previous low to recent high) from the new higher low .
- This level also aligns with the 1.5–1.618x Fibonacci extension of that swing, increasing its significance.
🔹 Dream Target: Another 100% projection
- Rare, but happens when momentum is very strong .
- In such cases, price might skip any retracement and launch directly into a second leg , equal to the previous swing.
- Here, the level aligns perfectly with the start of the last downtrend , just like the 2.618x extension in Method 1.
▋Mental Notes
▪ No one knows for sure if the breakout will be real or fake. But when it happens, knowing what to look for and where price might go next gives us a clear plan of action .
▪ The market will always find ways to surprise. Stay open and follow the flow.
▋Not Financial Advice
The information contained in this article is not intended as, and should not be understood as financial advice. You should take independent financial advice from a professional who is aware of the facts and circumstances of your individual situation.
BigBear.ai, Inc. (BBAI) Powers AI-Driven DecisionsBigBear.ai, Inc. (BBAI) provides artificial intelligence-powered decision support solutions for defense, healthcare, logistics, and manufacturing. Its platform helps clients process complex data to make faster, smarter decisions using predictive analytics and machine learning. BigBear.ai’s growth is driven by rising demand for AI in mission-critical operations, growing defense tech budgets, and the need for data-driven insights across both government and commercial sectors.
On the chart, a confirmation bar with rising volume signals bullish momentum. The price has entered the momentum zone by breaking above the .236 Fibonacci level. A trailing stop can be placed just below that level using the Fibonacci snap tool to help protect gains while staying in the trend.
UUUU Confirmed Breakout — Riding Volume, Momentum, and StructureEnergy Fuels (UUUU) continues to show strength as it cleanly breaks out of the $7.40–$7.90 Darvas Box range. Our Seed System captured multiple entries throughout consolidation and rode the move above $8 with clear trend confirmation.
Currently:
VWMA: $8.28 — riding above with strength
MACD: Strong, rising, bullish crossover
RSI: Elevated but still trending strong
Volume: Surging on each breakout leg
Entry was confirmed on break of $7.91 with stop below $7.40
Targets: $9.50 and $10.20
This setup aligns structure, momentum, and volume — a textbook Seed System breakout play.
#UUUU #SeedSystem #Breakout #DarvasBox #VWMA #MACD #SwingTrade #Uranium
QS Re-Tested Box Top – Waiting for $14.10 + VolumeQS is currently re-testing this morning’s high at $13.79 (box top).
VWMA and EMA alignment are bullish. MACD remains strong.
Plan: Buy above $14.10 on volume, stop at $13.20, trim at $15.00, extended target $16.50.
#QS #SeedSystem #DarvasBox #BreakoutWatch #VWMA #LiveUpdate
It's a time for Peloton Interactive, Inc. (PTON)-Target 8.20 $The chart analysis for Peloton Interactive, Inc. (PTON) suggests a potential rise with a target of 8.20 USD. The 4-hour chart indicates a recent downtrend from a peak around 10 USD, with the current price stabilizing near 6.30 USD. A key support level is observed around 6 USD, which could provide a strong base for an upward move. The 50-day and 200-day moving averages are converging, hinting at a possible trend reversal if buying pressure increases.
Breaking through the resistance at 6.50-6.70 USD, a recent consolidation zone, could trigger a rally. With rising volume and bullish candlestick formations, the price may aim for 8.20 USD, a significant resistance level based on prior highs. The RSI, currently in oversold territory, could support this upward movement if it starts to recover, indicating renewed momentum. However, a drop below 6 USD support could invalidate this outlook and lead to further declines.
Potential TP: 8.20 USD
Starbucks: Sideways Trend Continues Starbucks shares have remained in a sideways range over the past two weeks. This does not alter our primary outlook: We continue to see the stock in the dark green wave , which is expected to peak near the resistance level at $117.46. After reaching this high, we anticipate a move lower, with the stock dropping below the support at $71.53. However, since the intermediate high has not yet been established, an alternative scenario remains on the table: With a 31% probability, the dark green wave alt. could take hold first, driving the price below the $71.53 mark ahead of schedule.
📈 Over 190 precise analyses, clear entry points, and defined Target Zones - that's what we do (for more: look to the right).
Apple: Consolidation Before Potential Breakout Toward $260Apple shares have recently pulled back into a consolidation phase. We see further upside potential in magenta wave (B) before a pullback occurs as part of the same-colored wave (C), which is expected to target the low of green wave . After that, we anticipate a new upward move: Green wave should take over—remaining above support at $168—and drive the stock toward the next major resistance at $260.10. However, if the price drops back below the $168 support level, our alternative scenario comes into play: in that case, we would expect a lower low for blue wave alt.(IV), with a probability of 32%.
📈 Over 190 precise analyses, clear entry points, and defined Target Zones - that's what we do (for more: look to the right).
Is it a time for GAMESTOP? 30 $ in the sightAnalysis of the GameStop (GME) chart suggests a potential rise to 30 USD, based on current trends and technical levels. The 4-hour chart shows a recent decline following a sharp increase, with the price currently fluctuating around 23-24 USD. Key support is located at approximately 22 USD, which could act as a floor if the price starts to drop. The moving averages (e.g., 50-day and 200-day) indicate a previous upward trend, and current levels may represent a consolidation phase before the next upward move.
Breaking through resistance around 25-26 USD, which aligns with a previous peak, could pave the way for further growth. If demand increases and trading volume rises, the price could head toward 30 USD, a psychological and technical resistance level. Additional bullish signals, such as green candles or an increase in the oscillator (e.g., RSI) from current levels, could support this scenario. However, the risk of a sudden reversal should be monitored, especially if support at 22 USD is breached.
Potential TP: 30 USD
Catch the bounce on NVDAHi, I'm The Cafe Trader.
We’re taking a deeper dive into NVIDIA (NVDA) — one of the leaders in the MAG 7 — with a short-term trade setup you can apply to both shares and options.
Setup Context:
NVDA is pushing into all-time highs, and we’re now approaching the average analyst price target (around $180). While we don’t know how price will react at this level, traders should be watching for pullbacks and trend continuations — prime zones for entry.
If we get a strong move down, I see $153 as a high-probability bounce area — where buyers are likely to step in aggressively.
Price Target Outlook:
The final price target will depend on how price moves into this zone:
- If NVDA runs to $200 before pulling back, targets shift higher.
- If it tops out around $180, we adjust accordingly.
That said, an initial bounce toward $169–$170 looks reasonable.
Options Note:
If NVDA sells off hard and fast, implied volatility (IV) will spike, making options expensive and reducing your edge. This is a setup that could play out over 2–3 weeks, but the first bounce could be quick — so timing matters.
Strategy: Staggered Entry Using Two Contracts
Use two contracts — one short-term, one mid-term — to maximize reward while managing time decay.
Contract 1: Short-Term (3–5 Days to Expiry)
Trigger Entry: As soon as price taps the demand zone (~$153)
Strike Entry Price ^^Target Price
155 $2.00 ^^ $6.00
157.5 $1.50 ^^ $4.50
160 $0.75 ^^ $2.50
You’re looking for a quick reaction: get in, take profit, and step aside while the market finds new balance.
Contract 2: Medium-Term (7–10 Days to Expiry)
Timing Tip: Wait for NVDA to stall or consolidate after the initial bounce — this is when IV comes down and contracts get cheaper.
Strike Entry Price ^^Target Price
155 $3.00 ^^ $15.00
157.5 $2.50 ^^ $12.50
160 $1.80 ^^$9.00
Important: Be careful trading too close to earnings. Contracts tend to get overpriced right before and after earnings drops.
That wraps up the short-term NVDA view.
Stay tuned for more trades and setups across the MAG 7.
@thecafetrader
Take care, and happy trading!
Nike is a screaming BUY with target above 80$ in the short termSummary: In short NKE is on reversal mode to the upside and 80$ is on the horizon and 100$+ by next quarter Earnings call which is an upside over 40% NYSE:NKE
Nike (NKE): Technical Strength Above the 200 SMA 🟢
Nike (NKE): Recent Earnings Overview 🏅
Above the 200-Day Simple Moving Average (SMA) 🟩
NKE’s price is currently holding above the key 200-day simple moving average (SMA).
The 200 SMA is widely followed by investors as a long-term trend indicator.
Sitting above this level signals a bullish phase, as it often marks a shift from bearish to bullish market sentiment.
Historically, when a stock breaks and sustains above its 200 SMA after a downtrend, it attracts attention from institutional buyers and can act as a strong support area for further upside .
Key Takeaways from the Earnings Call
China Recovery 🐉
Positive business trends are emerging in greater China, supporting Nike’s international momentum.
Brand Momentum 🚀
Investments in product innovation, branding, and digital transformation remain central to growth.
Shareholder Return 💰
The continuation of share buybacks and regular dividends signals Nike’s commitment to delivering value.
How This Supports the Bullish Thesis
Momentum Confirmation:
Trading above the 200 SMA supports the idea that recent gains are not just a short-term bounce, but reflect a possible trend reversal toward sustained growth.
Institutional Buying Signal:
Many long-term investors and funds use the 200 SMA as a buy trigger, increasing the likelihood of strong follow-through buying.
Risk-Reward:
Being above the 200 SMA, with support from lower moving averages, strengthens the case for manageable downside risk and a clear technical floor.
Combined with recent Earnings, the technical breakout above the 200 SMA aligns with Nike’s solid Q4 earnings results, margin improvement, and positive guidance, all reinforcing confidence in the current rally.
Nike’s position above the 200-day simple moving average—combined with recent strong fundamentals—strengthens the bullish outlook for the stock at this key juncture..
Why This Matters for the Buy Thesis
Earnings Beat: Supports the recent surge in Nike’s stock price and adds conviction to a bullish outlook.
Margin Resilience: Operational improvements reduce risk, even in a tough retail environment.
Brand and Digital Strength: Focus on innovation and digital sales provides confidence for long-term investors.
In short NKE is on reversal mode to the upsie and 80$ is on the horizon and 100$+ by next quarter Earnings call
$HON Honey are you well NASDAQ:HON looking strong. Weekly chart is in a clear Stage 2 uptrend, now consolidating near all-time highs.
The 4-hour chart is holding key support around the $230-$233 level, with the Stochastic oscillator turning up from oversold territory. A decisive break above the $240 resistance could signal the next major leg higher.
#Honeywell #TechnicalAnalysis #Trading #Stocks
Just want to be there.. $LLYNYSE:LLY is showing classic signs of a Stage 3 top after its massive multi-year run. The trend has stalled, and the stock is now in a volatile sideways range.
Resistance: $975 Critical Support: $690
A weekly close below support would be a major bearish signal, potentially confirming the top and initiating a Stage 4 decline.
META Short📈 Scenario Outlook:
Bias: Bearish
Primary Expectation: Price is currently in a corrective decline and is expected to continue toward the 676.67 CHoCH level.
Bearish confirmation was seen upon rejection from the 713.20 mid-level, with price now printing lower highs and lower lows on the 4H chart.
This move may ultimately form a larger distribution pattern on the daily timeframe.
📌 Key Zones ("Your Borders"):
🔴 Mid-Supply Rejection Zone (Resistance)
Level: ~713.20 (50% equilibrium of last bearish swing)
This level acted as the midpoint during the retracement following the initial selloff from the top.
The market respected this region as a mid-range rejection, further reinforcing bearish momentum.
Failure to reclaim this level confirms bearish dominance in the short-to-medium term.
⚪ Target Zone / CHoCH Demand Test
Zone: 676.67 (CHoCH)
This is your projected draw on liquidity and primary downside target. It marks a structurally significant low where prior bullish order flow initiated.
If this level fails to hold, META may shift into a broader corrective phase, potentially unwinding a large portion of the prior rally.