LULU bullyou see it, we all see it. triple bottom with class A divergence and clear TP and SL, good luck!Longby YouKnowTheVibes0
$GPN is on WatchBullish Crossover on the daily Chart, with big box on the hourly chart. Waiting for a good wave 1-2 to comeLongby TizyCharts0
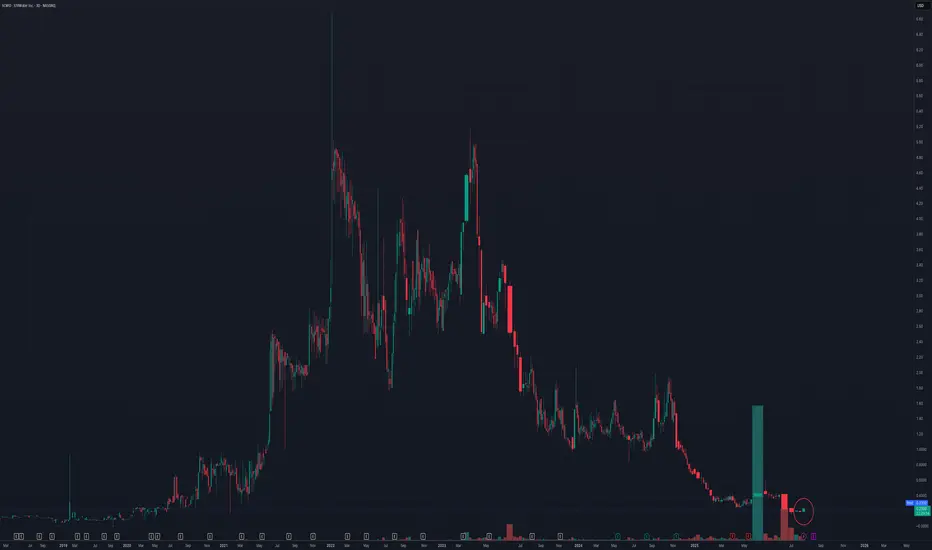
SCWO: High Risk, Big Potential374Water Inc. (NASDAQ: SCWO) is a U.S.-based environmental technology company specializing in waste management solutions. Their flagship innovation, AirSCWO™, utilizes supercritical water oxidation to effectively destroy organic waste, including PFAS and other contaminants. This technology is particularly relevant for municipal, industrial, and military applications.   ⸻ 📈 Bullish Catalysts 1. Government Contracts & DoD Engagement: 374Water’s AirSCWO™ technology has been deployed in a Department of Defense Environmental Security Technology Certification Program (ESTCP) project, highlighting its potential in federal applications.  2. Analyst Optimism: Analyst projections suggest a significant upside, with some forecasts estimating the stock could reach $2.55 within the next 12 months, representing over a 1,100% increase from current levels.  3. Insider Ownership: Approximately 20.3% of the company’s stock is held by insiders, indicating a strong belief in the company’s future prospects.  4. Revenue Growth Potential: Projections indicate a substantial increase in revenue, with expectations of $26.93 million this year and $55.69 million the following year, up from $0.45 million.  ⸻ 📊 Technical Analysis As of July 17, 2025, SCWO is trading at $0.23. Technical indicators present a mixed picture:  • Moving Averages: Short-term moving averages (MA5 to MA50) suggest a bullish trend, while longer-term averages (MA100 and MA200) indicate bearishness.  • Momentum Indicators: The Relative Strength Index (RSI) is at 72.6, suggesting the stock is overbought. The MACD is positive, indicating upward momentum.  • Volatility: The Average True Range (ATR) is 0.0083, reflecting high volatility.  ⸻ 🔮 Price Prediction Analyst forecasts for SCWO vary:() • Short-Term: Some models predict a modest increase to $0.50 by the end of 2025.  • Long-Term: Optimistic projections estimate the stock could reach $2.55 within 12 months.  ⸻ ⚠️ Risk Considerations Despite the bullish catalysts, investors should be cautious due to the company’s current financial metrics:() • Negative Earnings: The company has a negative net income of -$12.43 million and a net profit margin of -2,791.39%.  • High Volatility: The stock exhibits significant price fluctuations, which may not be suitable for all investors.() • Market Sentiment: Technical indicators suggest the stock is currently overbought, which could lead to a price correction.()by ipa220
Coca Cola to protect my portfolio and help it growOne of the most important things we must try to determine as investors is what company is the best at what they do in their field. In my opinion Coca Cola is and has always been the number one soft drink manufacturer, always finding new yet subtle ways to stay ahead of their competition. The reason I have allocated a decent amount of my portfolio to Coca Cola is a combination between their reliable track record of creating value, and paying dividends. People love junk food so it gives me high conviction to hold the stock long term. The company also demonstrates consistent, and reliable methods of generating organic revenue, and constantly finding new ways to cut costs and improve their profit margins. Despite what some other critics may claim about the stock being over valued, the intrinsic value of the stock happens to be $77 with a range between $48-$180. According to technical analysis it is over valued. I have too much respect for Coca Cola to trust technical analysis in my decision to hold the stock, I am rely solely on fundamentals. According to my perspective on the company it is in fact undervalued. Another positive catalyst I have noticed was when President Trump said he thinks Coca Cola should be made with cane sugar in the US, I think that would be a great idea, not only would it be healthier the soda would also taste better. Coca Cola looks like its going to stay ahead of the game for the foreseeable future.Longby Capitalist_Zach0
Caterpillar Wave Analysis – 17 July 2025 - Caterpillar broke long-term resistance level 410.00 - Likely to rise to resistance level 440.00 Caterpillar recently broke above the major long-term resistance level 410.00, which has been reversing the price from the end of 2024, as can be seen from the weekly Caterpillar chart below. The breakout of the resistance level 410.00 accelerated the active intermediate impulse wave (C) from the middle of 2025. Given the overriding weekly uptrend and the accelerating weekly Momentum, Caterpillar can be expected to rise to the next resistance level 440.00 (target for the completion of the active intermediate impulse wave (C)). Longby FxProGlobal0
TAP -- Breakout Attempt -- Target LevelsHello Traders! The chart of TAP (Molson Beer co.) is currently flirting with a major resistance trendline. Now whether or not price can successfully seal the deal and make it too third base remains to be seen. If price does breakout, watch for a potential retrace to the breakout trendline first, then we could see the larger move to resistance level #1. If price gets rejected and fails to breakout we could see a move below support before it attempts to breakout again. Thanks everyone and best of luck with your trading journey!Longby natef11
Coca-Cola Wave Analysis – 17 July 2025- Coca-Cola reversed from the support area - Likely to rise to resistance level 72.00 Coca-Cola recently reversed from the support area between the key support level 68.55 (which has been reversing the price from May), lower daily Bollinger Band and the 38.2% Fibonacci correction of the upward impulse (1) from January. The upward reversal from this support area stopped the previous minor ABC correction (ii). Coca-Cola can be expected to rise to the next resistance level 72.00 (which stopped the earlier waves B, 1 and i). Longby FxProGlobal0
Bullish for a new highI see a good confirmation for a bullish move to form a new high. 2 entry points with SL under last low. Not a financial advice. tell me your thoughtsLongby KINGIBRAHIM19810
Double Top Breakdown on AER 🧠 Double Top Breakdown on NYSE:AER Ticker : AerCap Holdings N.V. (AER) Timeframe : 1D (Daily Chart) Pattern : Double Top Strategy : Bearish Reversal ✍️ Analysis We’ve got a textbook Double Top forming after a strong bullish rally. Price failed to break above the $118 resistance twice, forming the classic M-shape. The neckline is around $113.50, almost broken. This setup is supported by: ✅ Clean pattern structure ✅ Volume Profile (VPVR) shows a low-volume gap below current price ✅ Good Risk/Reward structure 🎯 Trade Setup Entry : Below $113.50 (neckline break) Stop Loss : Above $115.50 (1.8% risk) Take Profit 1 : Around $110 (2.5% target) Larger TP target: $106 – matches VPVR high-volume node and pattern projection. It's also a Fibo retracement level of 38,2% of the rally. 📘 Educational Notes This is a great example of how a Double Top can signal the end of a bullish trend (at least temporary) and the start of a pullback or reversal. The volume gap below may accelerate the move. Managing risk with a tight SL and scaling out at TP1 and TP2 is key here. 💬 What do you think? Are you seeing the same setup on your end? 👍 Hit the rocket if you found this useful and follow for more clean technical setups! Shortby TopChartPatterns2
Bershire Hathaway Stock Analysis/BRK.AI looked at this particular stock because of insane activity from $623,302 to $741,590 in one day. That rejection told me to pay attention Money was coming to the door. So if the market is approaching this area again, rejection is the likely response. Looking at a short is temporary. This market is bullish in nature.06:03by Blondelady19710
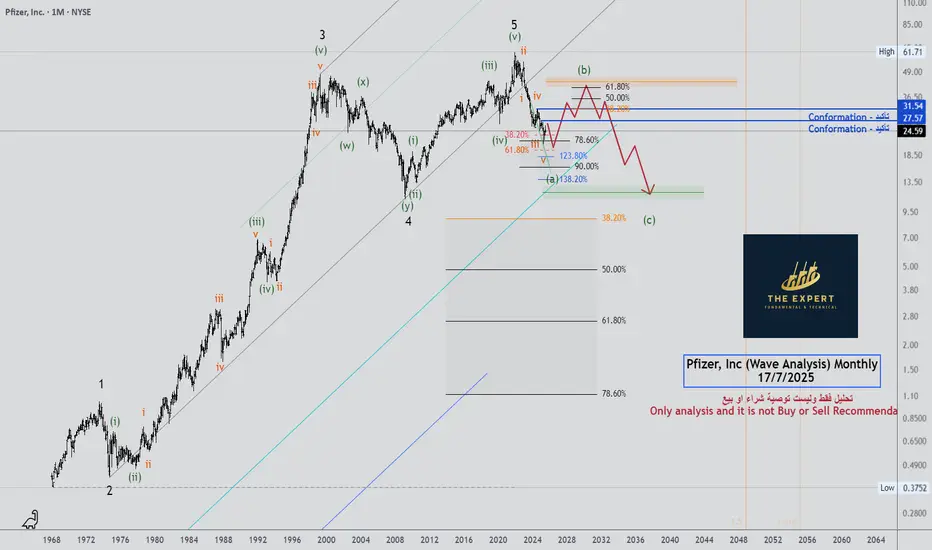
Pfizer, Inc (Wave Analysis) Monthly - Update 17/7/2025Pfizer, Inc (Wave Analysis) Monthly - Update 17/7/202 See the chartby yasser810
TSLA: Time for the 2/3 rally?TSLA remains tightly wedged inside a bullish pennant, hovering just above the ORB high (324.01) and within the premium SMC zone. Smart Money structure is clear: 🔹 Bullish BOS + CHoCH stacking 🔹 Fibonacci confluence from 0.618 to 0.886 holding strong 🔹 Hidden demand resting at 320.21 / 318.66 zone 🧠 VolanX DSS Logic: Break above 324.34 unlocks liquidity toward 1.236 = 325.68, then key magnet zone 326.56 Liquidity sweep + micro pullback ideal entry signal Volume shows absorption at each higher low → bullish intent 🎯 Trade Plan (15m): Entry: 322.00–324.00 with confirmation Target: 326.56 → 328.18 Invalidation: Below 320.21 BOS flip ORB + Fib + SMC stack = High-conviction directional play 💬 Price may seek inefficiencies left in prior imbalance zones below, but current order flow favors upside continuation. 📢 This analysis is powered by the VolanX Protocol under WaverVanir DSS — where liquidity meets logic. #TSLA #WaverVanir #VolanX #SMC #DayTrading #Fibonacci #ORB #SmartMoneyConcepts #Tesla #MacroEdge #OptionsFlowLongby Wavervanir_International_LLCUpdated 0
PATH --- Pop?PATH — Setting Up for a Pop? UiPath (PATH) is showing signs of strength as it builds a base just above key Fibonacci support and prepares for a potential breakout in the broader AI + Robotics narrative. Technical Setup: Price holding above the 38.2% Fib retracement from the May rally. Volume shelf + value area support at ~$12.30–$12.50 creating a launchpad. 21/50/200 SMAs converging — this type of compression often precedes expansion. TTM Squeeze building pressure — prior squeezes on this name have led to fast directional moves. Fundamental Tailwinds: PATH is an automation leader riding the AI + enterprise software wave. Sector rotation into Robotics and AI names (SYM, ROK, RR) lifting sentiment. Recent dark pool activity shows accumulation—large 8M+ share blocks suggest institutional interest. Thesis: A close above $12.70 could trigger a move into the $13.40–$14.60 resistance zone, with a possible gap fill toward $18 on strong momentum. Risk: Invalidation below $11.80 (50% retracement / SMA cluster). Tight risk-reward if using LEAPs or long shares.Longby Darth_Buddha0
VVPR/XRPHere's my VVPR/XRP fib channel. We're looking pretty good as the ratio spends too much time betwixt the .786 and the 1. It comes on the back of XRPUSD ascending triangle breakout. I've also shown you the VVPR/BTC bearish fib channel currently breaking out for the 1-level. So, both in Ripple and in Satoshis, Vivopower is going for the 1-level bear fib. It means Vivo will run bullish Ripple, while Ripple is running bullish in sats. Thank you for your kind attention.Longby Shammus01110
Waste Management confluencesFirst of all fundamentally the company is basically essential to our survival so I have no reason to believe they will go out of business any time soon. Earnings report soon should bring about some volatility. I was foolish enough to buy the top a couple months ago and deciding today I will add the the position because I like this price. Even though I bought the top, it was still below the intrinsic value at the time so it was a reasonable decision. With my simple trendline and rudimentary use of a Fibonacci I am able to set a price target of $260 depicted by my drawing of a potential new leg up. This is backed up by the absolutely fundamental usage of a calculation of the intrinsic value, which by my calculation is $280, and has a range between $170-$640 however these numbers may need to be adjusted after the earnings report. The value is now well below the intrinsic value so I am seeing this stock as a really good deal now. Despite any uncertainty in the economy Waste Management has seemed to outperform during these times so it is in my portfolio defensively. This stock is strong when it needs to be, which is why I like it.Longby Capitalist_Zach0
VVPR/BTCTop of the descending fib channel is about 260% pump in Satoshis. That's the point at which the bears start to rethink their decisions. If the ratio breaks out from the all-time bear fib, then it can run macro bullish sats. It's nearly impossible to find a ticker in your brokerage account that runs bullish sats for any length of time, but when you find it, it's nice to see.Longby Shammus010
Vivopower in SatoshisAnother view of VivoPower, but denominated in Satoshis. You can see my other chart of VivoPower denominated in Ripple. Everything is looking very bullish for VVPR as it breaks out, and tests the top of the sat fib channel. Lots of crazy action in extended hours, which is great to see, and volume running 3X trailing average at 9:00am in the morning. Good luck out there. Longby Shammus010
$ALAB Forming a Megaphone PatternNASDAQ:ALAB has seen a lot of volatility as of late. I took a position in it and was stopped out for a loss due to that volatility. I may be too fixated on this name, but I want to get involved as I think it has a chance to run to previous highs. I thought it had formed a cup with handle pattern, and I got involved on Wed. June 18th only to get stopped on Monday, Jun 23rd. I have been watching it since. Now it appears it is forming a megaphone pattern. These patterns usually resolve in the direction of the last trend. In this case that trend was up. I like too that the 50 DMA (red) is in an uptrend. I have an alert set on the upper trendline resistance area. Should that trigger, I will look for a good risk reward entry. If you like this idea, please make it your own and follow your trading plan. Remember, it is your money at risk. Longby jaxdog0
CRWV retest incoming?will we retest 130? That's my bet. I'm sure that Fri 7/18 will be wild as it is the monthly contract. Staying below 140, I'll hold my runners. After this bottom, I think we will reverse back upward to 145+Shortby mommymiles0
$ALAB coiled over AVWAP pinchNASDAQ:ALAB has been coiling in a tight range since May, when it vaulted over the AVWAP from the January high. Now above the AVWAP pinch from that Jan high and April low, consolidating above key moving averages, the stock looks ready to launch soon of the volume shelf at ~$90-92Longby Cuth90
ARQQ weekly pennantBeautiful weekly pennant on ARQQ weekly timeframe. This chart is coiling nicely for a continuation. Still early in the process of reaching breakout but given the recent momentum in this sector a premature break to the upside can happen at any moment. The ticker is currently sitting above the monthly 20ema (overlayed on this weekly chart), and just had a strong bounce off the daily 20ema (overlayed on this weekly chart). Golden cross is also highlighted that occurred in December 2024 with the daily 50ema retracing back to the daily 200ema and then continuing the uptrend earlier this spring. Longby BorrowedClothes0
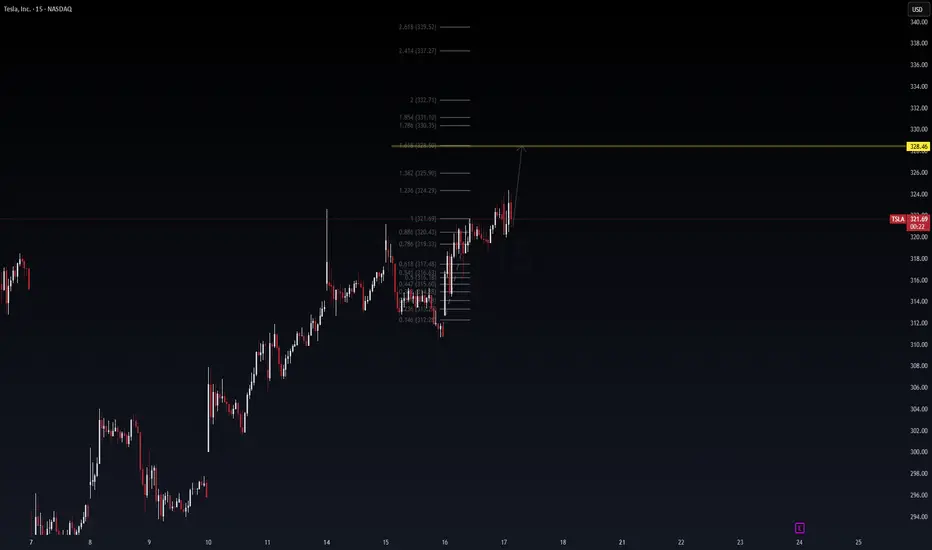
TSLA Fibonacci Launchpad: 328.46 in Sight? (15-min Daytrade Setu🔋 TSLA Fibonacci Launchpad: 328.46 in Sight? (15-min Daytrade Setup) Posted by WaverVanir_International_LLC | Powered by VolanX Protocol TSLA continues to show bullish continuation structure on the 15-min timeframe. After a textbook retracement to the golden pocket (0.618–0.786), bulls defended $315-$317 zone and reclaimed $321 resistance. 📌 Technical Thesis Clean impulsive wave from $312.24 → $321.69 Consolidation → Breakout structure with low selling volume Fib extension targets 1.618 at $328.46, followed by confluence zones at $331 and $332.71 Price respecting higher lows, forming micro bull flag 📈 Entry Idea: Intraday breakout confirmation above $324.29 (1.236 extension) Risk-managed long setup with stops below $320.43 (0.886) Target zones: $328.46 → $330.35 → $332.71 ⚠️ Risk Note: Heavy resistance expected around $328–$332 zone. Scalp profits near extensions or trail stops tight. 🔮 VolanX Signal Score: 7.5/10 Favoring upside continuation unless macro catalyst shocks sentiment. #TSLA #DayTrading #Fibonacci #Scalping #VolanX #WaverVanir #TechStocks #OptionsFlow #AITrading #PriceTargets #TeslaTradersLongby Wavervanir_International_LLC0
 Long
Long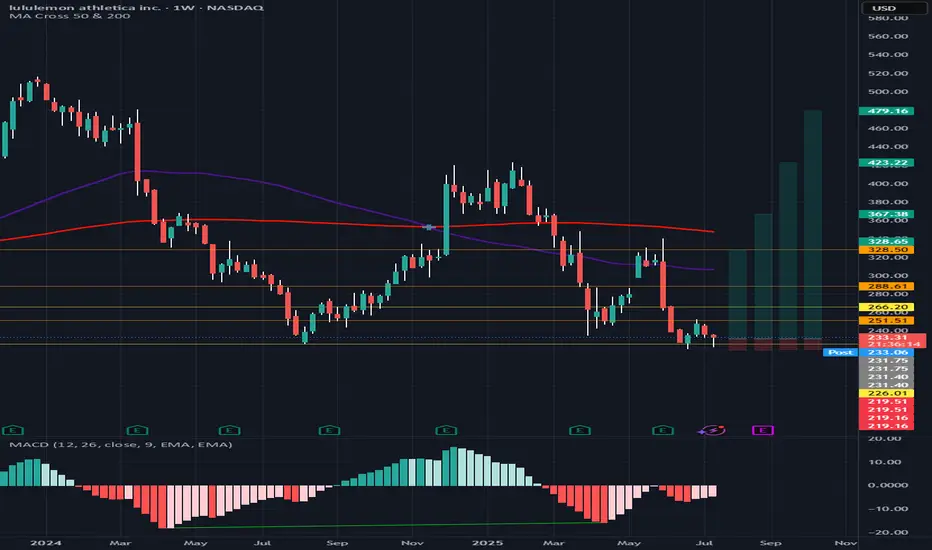
 Long
Long
 Long
Long

 Long
Long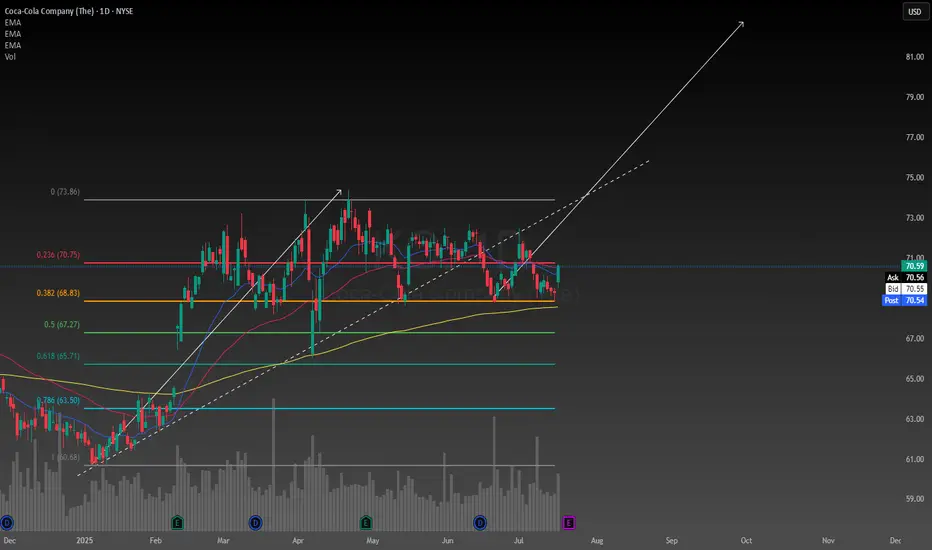
 Long
Long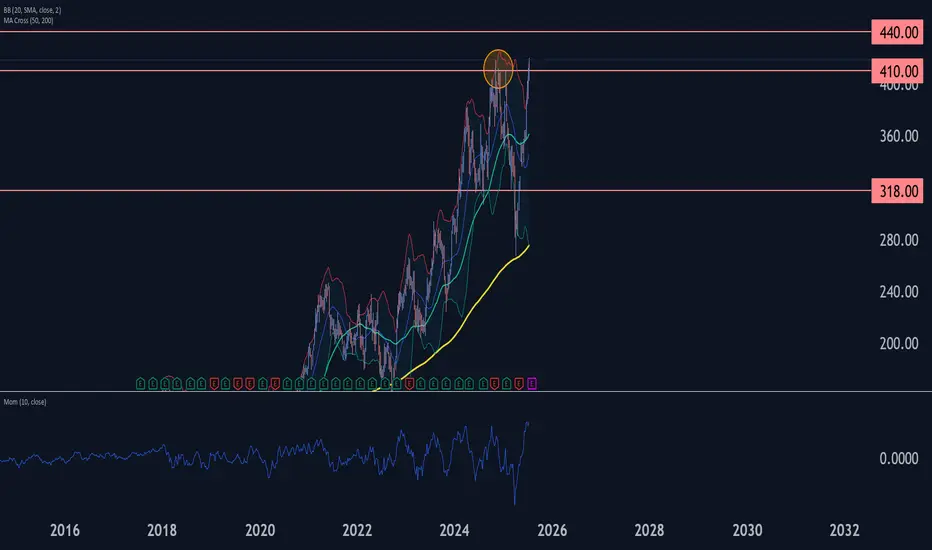
 Long
Long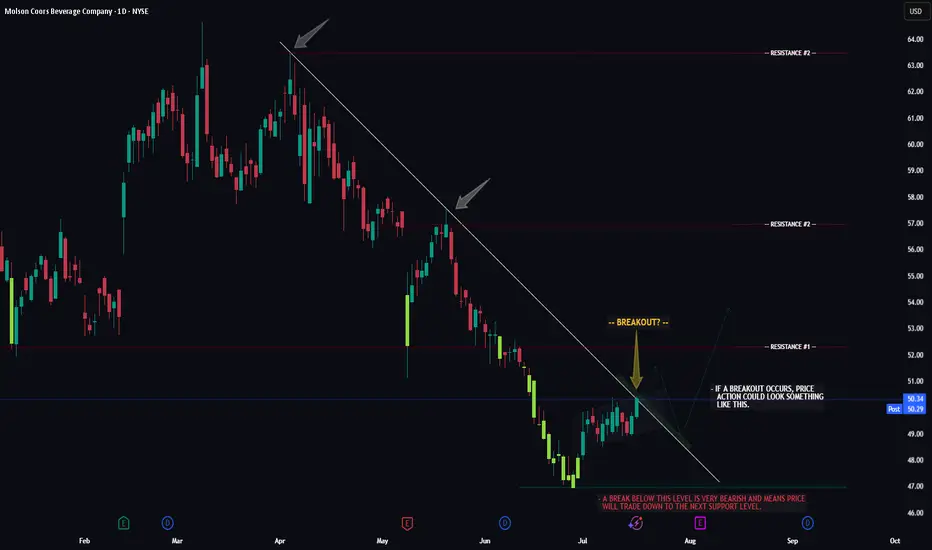 Long
Long
 Long
Long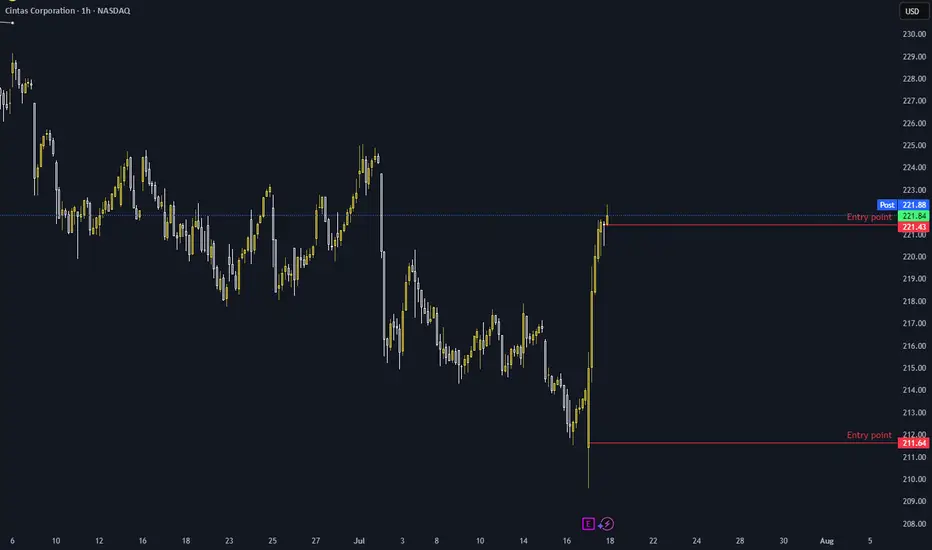
 Short
Short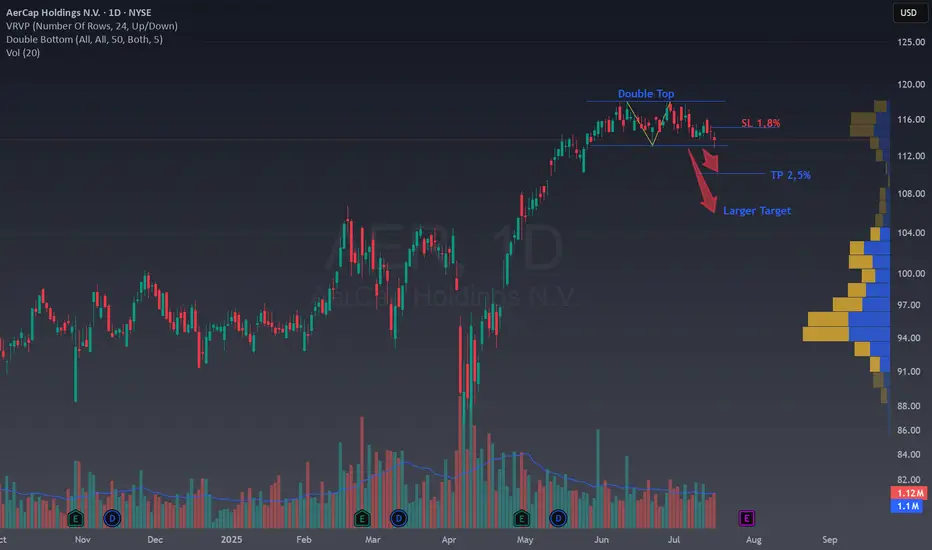


 Long
Long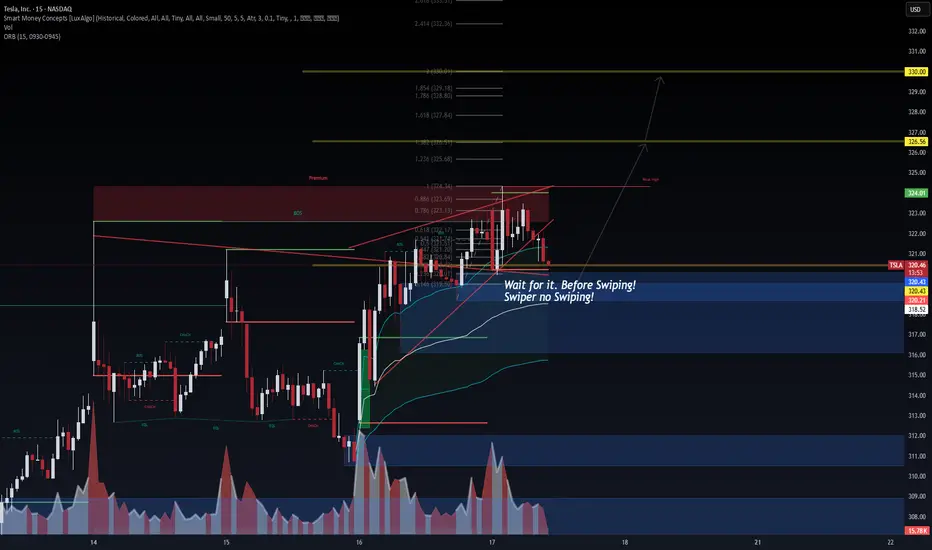
 Long
Long
 Long
Long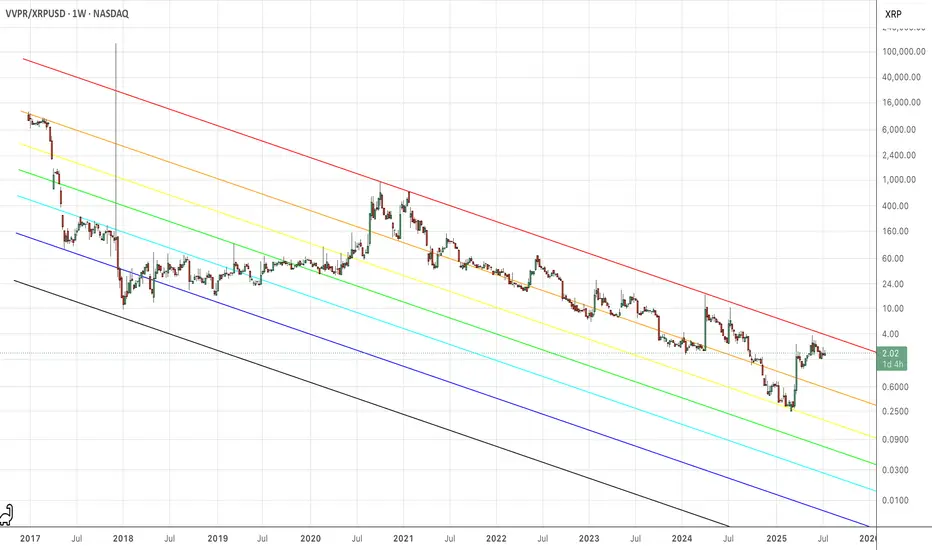
 Long
Long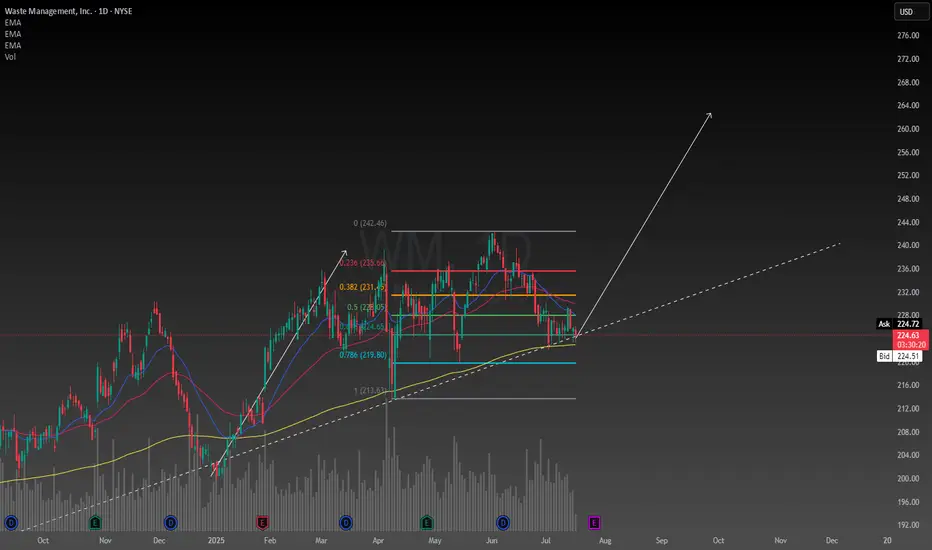 Long
Long Long
Long
 Long
Long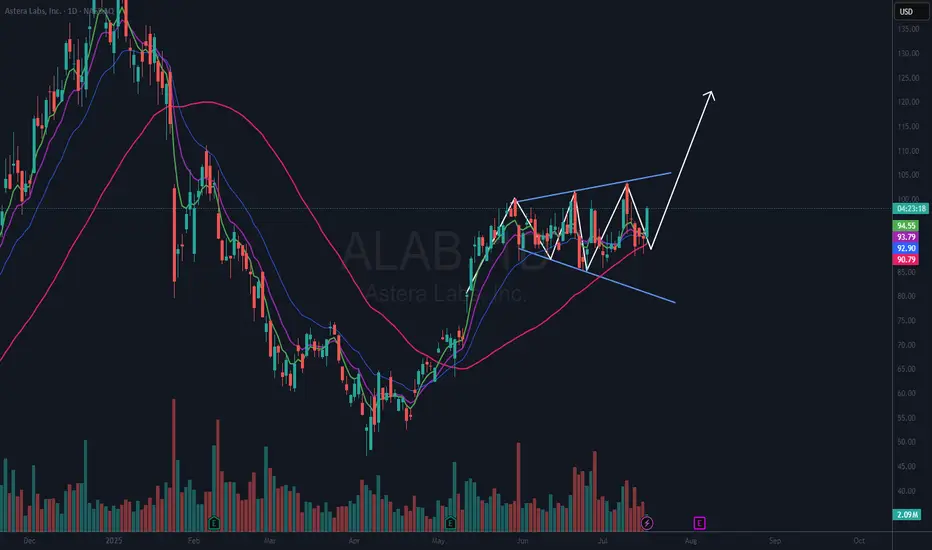
 Short
Short Long
Long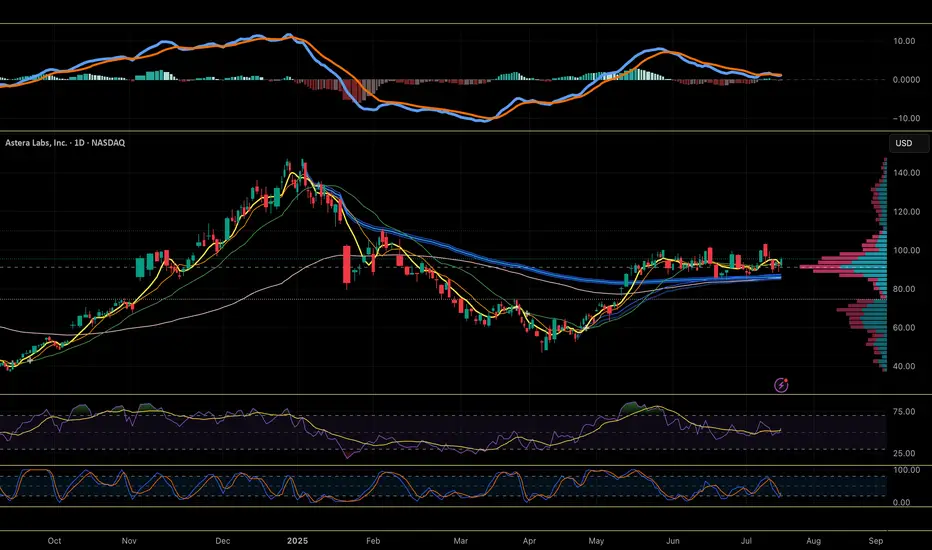
 Long
Long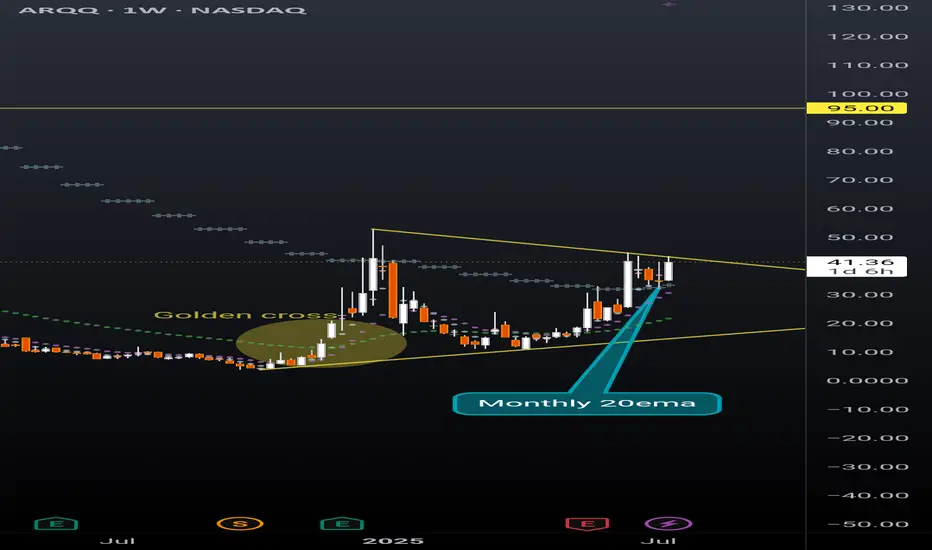 Long
Long