EdgeTradingJourney
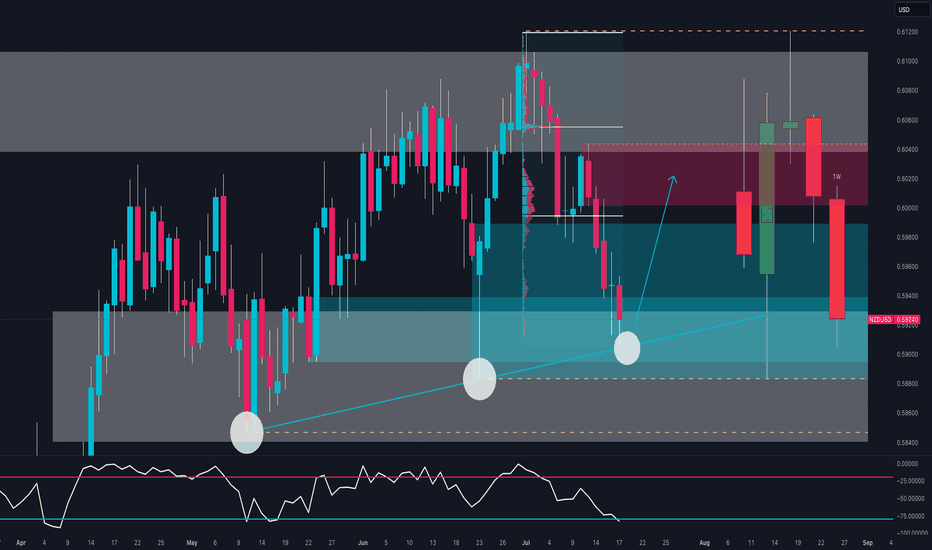
PremiumBias: Bullish Bounce from Key Demand Zone NZD/USD is testing a strong confluence zone: Long-term ascending trendline support Weekly demand area between 0.5890 and 0.5940 Bullish RSI divergence near oversold conditions The triple rejection wicks signal strong demand around 0.5900, suggesting a possible reversal toward the 0.6020–0.6050 resistance area. 🧠 COT...
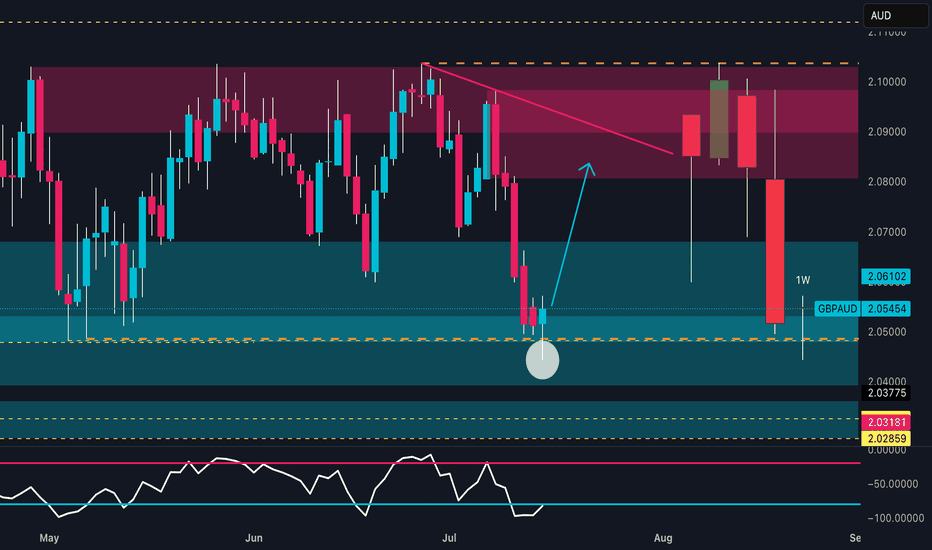
📊 Technical Outlook Price strongly reacted from a key weekly demand zone between 2.0400 and 2.0500, showing clear absorption of bearish pressure. The RSI is rebounding from the 30 area, signaling early reversal potential. The next technical target lies between 2.08900 and 2.10000, within a well-defined supply zone. An early bullish reversal is in progress, with...
COT & MACRO FLOW (Commitment of Traders) USD INDEX Non-commercials still biased short: Longs 16,208 vs Shorts 20,194 (slightly improved, but still negative). Commercials remain net long, but the open interest is declining → no strong conviction from smart money. JPY Non-commercials added significantly to their short exposure (+6,751), while cutting longs...
EUR/JPY – Institutional Macro Context (COT) EUR (Euro) Non-commercials net longs increased by +16,146 → strong buying. Commercials added +25,799 long positions. ✅ Bias: Moderately bullish. JPY (Japanese Yen) Non-commercials decreased longs by -4,432. Commercials cut -20,405 long contracts. ❌ Bias: Bearish pressure remains on JPY. Conclusion (COT): EUR remains...
1. Price Action & Technical Structure Price has bounced off a strong daily demand zone (1011–969). Today’s daily candle shows a clear rejection wick from the low, and RSI is signaling a potential reversal. The market is trading inside a falling channel, currently near the lower boundary — setting up a possible breakout move. Technical Targets: • First upside...
Price has entered the daily supply zone (red area) between 170.80 and 171.80, showing immediate rejection with a long upper wick — a signal of potential short-term bearish reaction. The RSI is turning lower, indicating loss of momentum, although it hasn’t reached extreme levels yet. The current map suggests a technical pullback toward the 169.40–168.50 zone (FVG...
Price has broken below the ascending channel that started in mid-May. The current candle is rejecting the weekly supply zone (1.17566–1.18319), leaving a significant upper wick. Daily RSI is losing strength but has not yet reached extreme levels. A key daily Fair Value Gap (FVG) lies between 1.1600 and 1.1480, with the first potential downside target at 1.14802,...
🧠 MACRO & INSTITUTIONAL FLOWS (COT) EURO (EUR) Strong increase in net long positions by non-commercials: +16,146 Commercials also added long exposure: +25,799 Bias: moderately bullish AUSTRALIAN DOLLAR (AUD) Non-commercials remain heavily net short (long/short ratio: 15% vs 63.6%) Slight increase in commercial longs: +2,629 Bias: still bearish, but showing early...
1. Technical Context The pair has been moving inside a well-defined bullish channel since May, forming higher highs and higher lows. Price is currently hovering around 1.1718, approaching the upper boundary of the channel and a key weekly supply zone (1.1750–1.1850). ➡️ Potential scenario: A short bullish extension toward 1.1780–1.1820 to trigger stop hunts,...
📉 1. Price Action & Technical Structure (D1) Key demand zone tested with bullish reaction: Price reacted strongly around the 1.0790–1.0840 structural demand area, previously the origin of a significant bullish impulse. The latest daily candle closed above the previous swing low, suggesting a potential technical rebound. Immediate target: The 1.0980–1.1010 zone,...
1. COT REPORT — Updated June 17, 2025 📌 Non-Commercials (Speculators) Long: +5,661 → 195,984 Short: -9,226 → 110,761 ✅ Net Long Increase: A clear bullish shift in speculative positioning (+14,887 net contracts). This is an early indication of a sentiment reversal. 📌 Commercials (Hedgers / Producers) Long: +6,023 Short: -5,806 ➡️ The decrease in net shorts...
🧭 Technical Context Price is currently sitting at the key support area of 0.5890–0.5900, tested multiple times since April. This week’s candlestick shows a clear close below the intermediate micro-structure (two consecutive closes under recent lows), confirming bearish pressure. The weekly RSI remains in a neutral-to-low zone, trending downwards with no active...
📊 COT Analysis GBP: Non-Commercials remain net long with 106,282 longs vs 63,425 shorts. However, long positions are decreasing (-4,794) while shorts are slightly increasing (+3,983), suggesting profit-taking or a potential shift in sentiment. Commercials are strongly net short (35,707 longs vs 87,770 shorts), with a significant reduction in both longs (-24,958)...
1. Price Action Price is currently trading within a descending channel, with 0.5244 hovering near a key demand zone (0.5150–0.5200), where a first bullish reaction has already occurred. The structure suggests a potential fake breakdown, with room for a rebound toward static resistances at 0.5330, and possibly 0.5450. RSI is rising from oversold, showing signs of a...
📊 1. COT Analysis JPY (Japanese Yen): Non-Commercial Net Long: +54,615 – showing strong long accumulation since March. Recent Changes: Long: -5,319 Short: +1,235 ➡️ Mixed signals short-term, but overall net long positioning remains strong. Speculative funds are still heavily favoring the Yen, suggesting potential continued strength. GBP (British...
🧠 COT Sentiment Speculators are heavily net short on CAD (–93K), while maintaining a strong net long position on JPY (+144K). → This positioning clearly favors JPY strength over CAD weakness. Commercials are hedging JPY downside, but the dominant flow remains JPY bullish. 📅 Seasonal Patterns Historically, June is weak for CAD (5Y, 10Y, 15Y averages all...
📊 1. COT Report – Euro & Yen EUR (Euro FX – CME): Non-Commercials: Long: +5,968 | Short: -4,293 → Net Long increasing Commercials: Long: +11,480 | Short: +24,451 → Net Short → Speculators are clearly bullish on the euro. JPY (Japanese Yen – CME): Non-Commercials: Long: -5,319 | Short: +1,235 → Net Long decreasing Commercials: Long: +31,893 | Short: +25,462 →...
🧠 1. COT Context & Institutional Flows 🇨🇦 CAD COT Report (CME) – June 10, 2025 Non-Commercials (speculators): net short 93,143 contracts (19,651 long vs. 112,794 short), with a short reduction of -14,319 → early bearish unwinding. Commercials: net long 91,207 contracts (223,285 long vs. 132,078 short), with strong accumulation (+27,999 longs). 🔄 Net open...


